-
Property & Casualty
Property & Casualty Overview

Property & Casualty
We offer a full range of reinsurance products and the expertise of our talented reinsurance team.
Expertise
Publication
Florida Property Tort Reforms – Evolving Conditions
Publication
Is Human Trafficking the Next Big Liability Exposure for Insurers?
Publication
When Likes Turn to Lawsuits – Social Media Addiction and the Insurance Fallout
Publication
Generative Artificial Intelligence and Its Implications for Weather and Climate Risk Management in Insurance
Publication
Engineered Stone – A Real Emergence of Silicosis
Publication
Who’s Really Behind That Lawsuit? – Claims Handling Challenges From Third-Party Litigation Funding -
Life & Health
Life & Health Overview

Life & Health
We offer a full range of reinsurance products and the expertise of our talented reinsurance team.

Publication
Understanding Physician Contracts When Underwriting Disability Insurance
Publication
Voice Analytics – Insurance Industry Applications [Webinar]
Publication
GLP-1 Receptor Agonists – From Evolution to Revolution U.S. Industry Events
Publication
Always On: Understanding New Age Addictions and Their Implications for Disability Insurance
Publication
Dying Gracefully – Legal, Ethical, and Insurance Perspectives on Medical Assistance in Dying -
Knowledge Center
Knowledge Center Overview

Knowledge Center
Our global experts share their insights on insurance industry topics.
Trending Topics -
About Us
About Us OverviewCorporate Information

Meet Gen Re
Gen Re delivers reinsurance solutions to the Life & Health and Property & Casualty insurance industries.
- Careers Careers
Key Drivers of Mortality – The Latest Research

October 27, 2021
Jean-Marc Fix
Region: North America
English
As we’re well into the second year of the pandemic, mortality is front page news. This topic, normally of interest only to a few demographers and actuaries, is now top of mind for many. But before COVID took its rightful place on the front pages, mortality improvement in the United States had diverged from its historic trend and slowed down. The question is, Why? And how will the future mortality trend affect insureds?
Insurers have known for a long time that the mortality rate of an insured population is much better than in the general population. This difference is critical for insurers, but there hasn’t been enough insurance data to fully understand mortality improvements, so we must rely on population mortality to guide our analysis.
To help develop our understanding, the Society of Actuaries (SOA) Research Institute commissioned a series of studies in order to understand the different components of mortality across the U.S. population. The studies’ goal was to move from looking at all‑cause mortality to looking at the causes of death that generate that mortality – and finally, to looking at the drivers that impact those causes of death to get a better understanding of the changes in the future.
Another study just released from the SOA Research Institute focused on those drivers and their historical impacts.1
4 Mortality Drivers – And 7 Risk Factors
In the general population, four drivers have an impact on mortality:
- Socioeconomic factors
- Behavioral risk factors
- Metabolic risk factors
- Healthcare
It is clear that those factors are interrelated. The literature review in the SOA Research Institute study pointed to metabolic and behavioral risk factors as being the most important drivers of socioeconomic difference in mortality, with access to healthcare a secondary but still significant factor.
Within the behavior and metabolic categories of drivers, the researchers identified seven risk factors, which should be familiar to any student of underwriting:
- Behavioral: Dietary risk, Tobacco, and Alcohol & Drug use
- Metabolic: Hypertension, Obesity, Diabetes and High Cholesterol
For its analysis of risk factors, the SOA Research Institute study focused on smoking, obesity, accidental drug poisoning, alcohol abuse, hypertension, dementia and Alzheimer's, HIV and AIDS, suicide, and homicide.
Period and Cohort Effects on Mortality
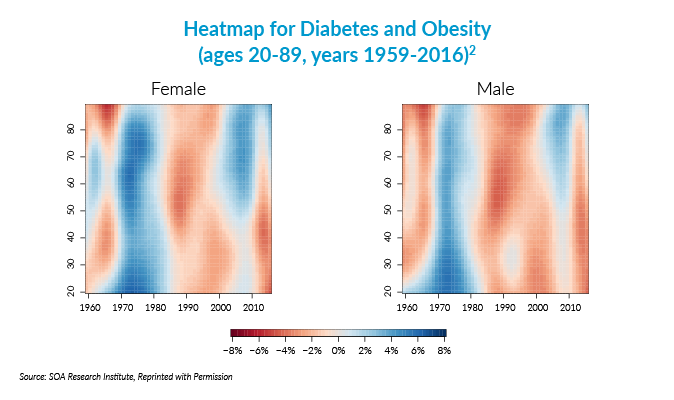
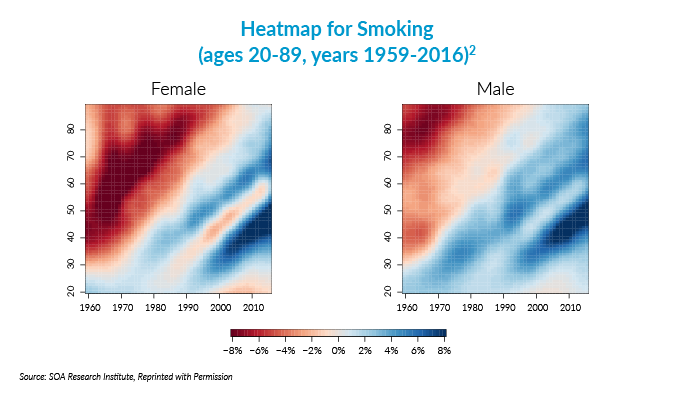
Although the study’s discussion of findings is very long and may be intimidating, it has a lot of figures that offer interesting insights. For example, heat maps showed cause of death by age, period and cohort components. Using color visuals to indicate data values, heat maps clearly delineate the differences between causes for each of those three components.
Heat Maps
If we look at the heat map for selected risk factors, we see that AIDS, dementia, diabetes and obesity, homicide, and hypertensive disease are mostly period‑driven.

On the other hand, smoking is cohort sensitive, as different generations picked up smoking at different paces. Interesting to note is that drug dependency, alcohol use and self-harm, which are the linked to the so‑called deaths of despair, started having a cohort effect between 1980 and 1990 and are now cohort-driven. They were more period-driven before 1980.

Period Effects
Digging deeper into the heat maps’ meaning, some causes are subject to period effects, in which case everyone suffers or improves in the same time period. A period effect thus refers to the mortality of a range of ages that are simultaneously affected. A striking example is the AIDS epidemic, which increased the mortality for middle-aged males in the 1980s to the early 1990s. Females were also affected but to a much lesser extent.
We are much more familiar with period effects than cohort effects as they are more likely to be reported in the news. The researchers identified five periods, of alternatively increasing and decreasing mortality improvement. The period 1959 to 1970 was marked with a stagnation of mortality improvement but was followed by the 1970 to 1980 period of above-average increase in mortality improvement – improvements across many causes, except cancer. This was followed by a period of below-average mortality improvement as AIDS started kicking in from 1980 to 1995. This in turn was followed by another period of above-average increase from 1995 to 2010 where the benefits of effective HIV therapy accelerated the process of improvement.
From 2010 to 2016, we again entered a period of slower-than-average improvement in mortality or maybe no improvement at all; the researchers then show that the cardiovascular improvements trend slowed down and a number of other behavioral factors, dietary risk, and tobacco, alcohol and drug use, which we discussed earlier, kicked in.
Cohort Effects
Some causes vary more by year of birth, the so‑called cohort effect. A cohort effect refers to a comparison of one group of people born in the same range of years relative to another group born in the same (or different) range of years. An example is smoking affecting the generation born in the first few decades of the 20th century where smoking in early adulthood had a tremendous impact on mortality. This impact was seen in females as well but it occurred a few years later than males, as they in turn picked up smoking.
Looking at cohort effects, the researchers identified males born between 1940 and 1955 and, to a lesser extent, females born between 1945 and 1960 as an underperforming cohort from a mortality improvement standpoint, compared to other cohorts.
Challenges in Distinguishing Effects of Age, Period and Cohort
When we try to deduce the effect on mortality of three different variables – age, period, and cohort, we face a few technical difficulties. The first one is that age, period, and cohort are related so isolating one effect without another may not result in completely valid conclusions. The second issue is how to prioritize the order of the three variables as they enter the formula for analysis, which is important because the prioritized (“first”) variable will have an impact on the ones that follow and become the primary effect. The researchers chose period as the primary effect, a reasonable decision but with consequences for the cohort effect that are important to keep in mind when looking at the study’s conclusions.
Lessons Learned
A lesson we learn from this research is that each of the causes of death is affected differently, some more by period effects, and others more by cohort effects. Looking at “all causes” of death masks a lot of what could be important insights on mortality that are revealed when looking at cause by cause.
Of course, this research opened the door to a lot of questions, and it will be interesting to see what answers we can identify, and ultimately what factors are at play today that will affect the mortality of tomorrow.
Endnotes
- Andrés M. Villegas, Madhavi Bajekal, Steven Haberman, and Luke Zhou. “Analysis of Historical U.S. Population Mortality Improvement Drivers 1959-2016.” Society of Actuaries Research Institute Report (September 2021). https://www.soa.org/resources/research-reports/2021/analysis-historical-us-drivers.
- Ibid., 65. Reproduced with permission.
- Ibid., 66. Reproduced with permission.


