-
Property & Casualty
Property & Casualty Overview

Property & Casualty
We offer a full range of reinsurance products and the expertise of our talented reinsurance team.
Expertise
Publication
Structured Settlements – What They Are and Why They Matter
Publication
PFAS Awareness and Concern Continues to Grow. Will the Litigation it Generates Do Likewise?
Publication
“Weather” or Not to Use a Forensic Meteorologist in the Claims Process – It’s Not as Expensive as You Think
Publication
Phthalates – Why Now and Should We Be Worried?
Publication
The Hidden Costs of Convenience – The Impact of Food Delivery Apps on Auto Accidents
Publication
That’s a Robotaxi in Your Rear-View Mirror – What Does This Mean for Insurers? -
Life & Health
Life & Health Overview

Life & Health
We offer a full range of reinsurance products and the expertise of our talented reinsurance team.

Publication
Key Takeaways From Our U.S. Claims Fraud Survey
Publication
Favorite Findings – Behavioral Economics and Insurance
Publication
Individual Life Accelerated Underwriting – Highlights of 2024 U.S. Survey
Publication
Can a Low-Price Strategy be Successful in Today’s Competitive Medicare Supplement Market? U.S. Industry Events

Publication
The Latest in Obstructive Sleep Apnea -
Knowledge Center
Knowledge Center Overview

Knowledge Center
Our global experts share their insights on insurance industry topics.
Trending Topics -
About Us
About Us OverviewCorporate Information

Meet Gen Re
Gen Re delivers reinsurance solutions to the Life & Health and Property & Casualty insurance industries.
- Careers Careers
Medicare Supplement – Highlights of 2020 U.S. Market Survey

August 31, 2021
Lisa Bolduc
Region: North America
English
Gen Re Research Center in North America is pleased to present this summary of key highlights from our 2020/2021 Medicare Supplement Market Survey. The full report covers Medicare Supplement (Med Supp) results and market trends for 2020, capturing sales and in-force data, claim metrics, underwriting tools and practices, rate increase activity and compensation and distribution details. The comprehensive report is made available only to participating companies. It’s a valuable opportunity for participants to benchmark their results against those of their peers, as well as the industry as a hole.
A total of 44 questionnaires were completed for this year’s survey, representing 88 companies with Med Supp business.
Throughout this summary report, the percentage (or number) of companies refers to the 44 completed questionnaires. Depending on the type of question, not all companies were eligible provide a response. To aid in your review, the number of respondents is displayed as “R=.” When reviewing the results please note that participants may vary from year to year. Participating companies were segmented by whether they reported open and/or closed blocks of Med Supp business. “Open blocks” refers to blocks of business that accepted new applications in 2020. Most companies (57%) manage both open and closed blocks.

Total Annualized In-force Premium and Lives for 2020
Participating companies reported $23.8 billion of Medicare Supplement in-force premium for 2020, increasing by 3.5% compared to 2019. Participants also reported 9.7 million covered lives, basically unchanged from 2019. Open blocks account for 67% of the total premium or $16 billion. (Exhibit A)

Total Annualized Sales Premium and Lives for 2020
Nearly $1.5 billion of Med Supp sales premium was reported for 2020 compared to $1.7 billion for 2019. The decline of 12% is mainly due to one company whose 2019 premium from new sales was heavily inflated due to sunsetting of Medicare Cost plans. When excluding them from the growth calculations, new sales premium increased by about 3% and lives grew by 4% over 2019. (Exhibit B)

Source of Sales Premium and Lives
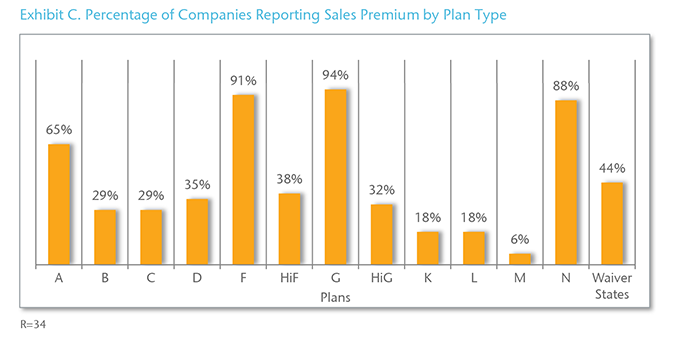
In 2020, over 90% of the participating companies sold Plans F and G. Plan N was also popular with 30 companies (88%) selling that plan. (Exhibit C)
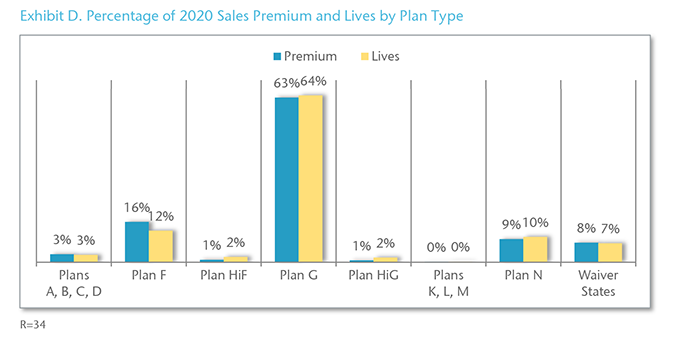
On a combined basis, Plans F and G account for 79% of the total new sales premium and 76% of new lives. (Exhibit D)
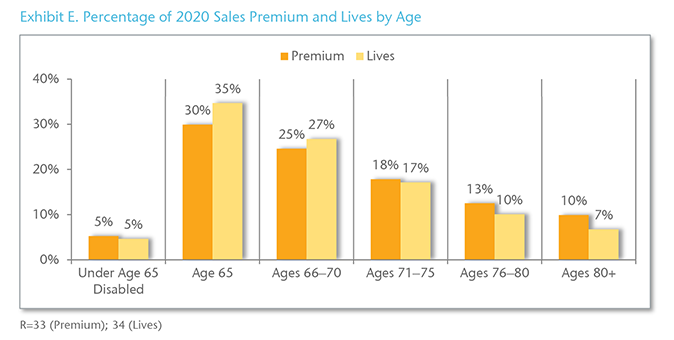
In 2020, policyholders aged 65 represent 30% of new sales premium and 35% of new lives. (Exhibit E)
Open enrollment and underwritten applications accounted for the majority of 2020 new sales premium at 42% and 39%, respectively. (Exhibit F)

Claims Trend
Regardless of plan type or whether the block is open or closed, most companies observed a negative claims trend for 2020. For open blocks of 2010 plans, the 2020 observed claims trend averaged -3%, while for closed blocks of 2010 plans, the claims trend averaged -6%. (Exhibit G)

Lapse Rates
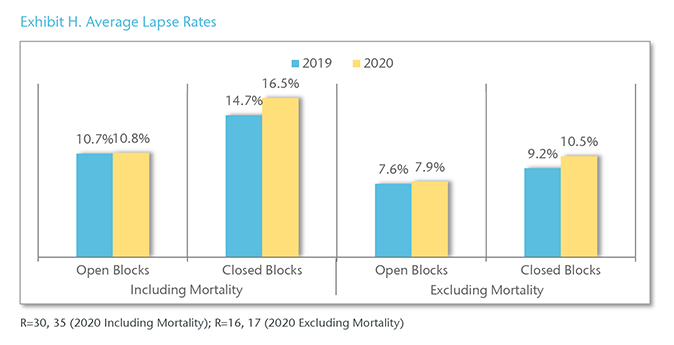
For 2020, lapse rates including mortality averaged 11% for open blocks and 17% for closed blocks. Excluding mortality, lapse rates averaged 8% and 10%, respectively, for 2020. (Exhibit H)
Underwritten Applications (Open Blocks Only)
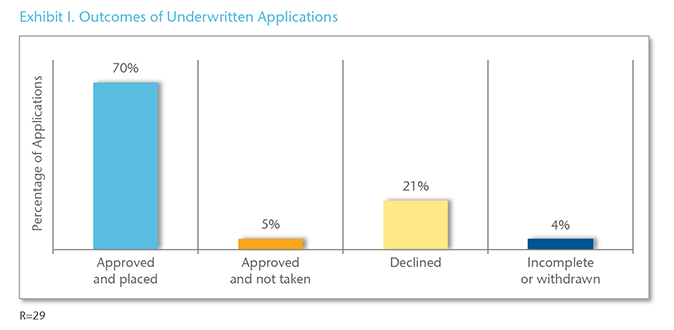
On average, 70% of underwritten applications were approved and placed, while 21% were declined. Of the 29 participating companies, 16 reported a decline rate greater than 20%. (Exhibit I)
Processing Time for Underwritten Applications
In 2020, the average turnaround time for underwritten applications was 4.2 business days, ranging from one to 11 days. On average, companies keep an application open 41 days to obtain a requirement before closing it due to incomplete information. (Exhibit J)

Automated Underwriting Systems
For the purpose of this survey, an automated underwriting system was defined as a system used to make decisions on underwritten, web-based applications without human involvement. Of the 32 responding companies, 11 (34%) use an automated underwriting system and five (16%) plan to implement a system within the next 24 months.
Claims Process
All responding companies auto-adjudicate claims. Of the 40 respondents, 25 (63%) auto-adjudicate 90% or more of their claims. (Exhibit K)
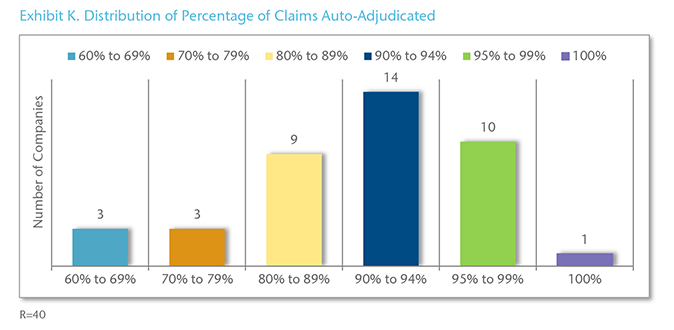
On average, 88% of claims are auto-adjudicated, ranging from 63% for a company with only a closed block of business to 100%. (Exhibit L)

Quality Assurance Programs
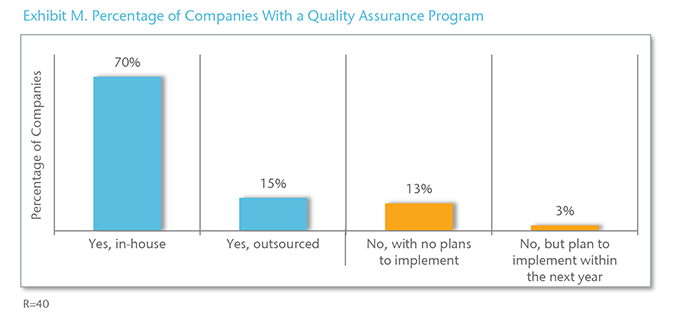
Of the 40 respondents, 34 (85%) have a Quality Assurance (QA) program, with most occurring in-house. Of the six companies without a QA program, one plans to put a system in place within the next year. (Exhibit M)
Distribution Channels (Open Blocks Only)
Of the 32 respondents, 29 (91%) sell Med Supp through independent agents and more than half (56%) sell direct-to-consumer. (Exhibit N)
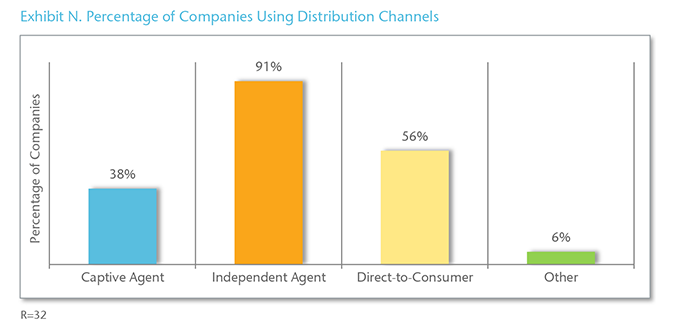
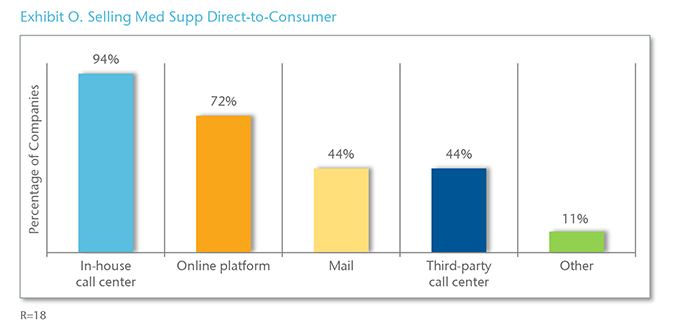
Direct-to-consumer was defined as selling a Medicare Supplement policy via the phone, online, the mail, or a combination of these methods without the assistance from a traditional agent who is paid a traditional compensation. Consumers can apply for coverage and go through the process without ever having to communicate with anyone.
Of the companies selling direct-to-consumer, 94% use an in-house call center compared to 44% that rely on a third-party call center. (Exhibit O)
Download the PDF version for a list of participating companies.


