-
Property & Casualty
Property & Casualty Overview

Property & Casualty
We offer a full range of reinsurance products and the expertise of our talented reinsurance team.
Expertise
Publication
Florida Property Tort Reforms – Evolving Conditions
Publication
Is Human Trafficking the Next Big Liability Exposure for Insurers?
Publication
When Likes Turn to Lawsuits – Social Media Addiction and the Insurance Fallout
Publication
Generative Artificial Intelligence and Its Implications for Weather and Climate Risk Management in Insurance
Publication
Engineered Stone – A Real Emergence of Silicosis
Publication
Who’s Really Behind That Lawsuit? – Claims Handling Challenges From Third-Party Litigation Funding -
Life & Health
Life & Health Overview

Life & Health
We offer a full range of reinsurance products and the expertise of our talented reinsurance team.

Publication
Understanding Physician Contracts When Underwriting Disability Insurance
Publication
Voice Analytics – Insurance Industry Applications [Webinar]
Publication
GLP-1 Receptor Agonists – From Evolution to Revolution U.S. Industry Events
Publication
Always On: Understanding New Age Addictions and Their Implications for Disability Insurance
Publication
Dying Gracefully – Legal, Ethical, and Insurance Perspectives on Medical Assistance in Dying -
Knowledge Center
Knowledge Center Overview

Knowledge Center
Our global experts share their insights on insurance industry topics.
Trending Topics -
About Us
About Us OverviewCorporate Information

Meet Gen Re
Gen Re delivers reinsurance solutions to the Life & Health and Property & Casualty insurance industries.
- Careers Careers
Medicare Supplement – Highlights of 2018/2019 U.S. Market Survey

September 19, 2019
Lisa Bolduc
Region: North America
English
Gen Re is pleased to present this summary of key highlights from our 2018/2019 U.S. Medicare Supplement Market Survey. The full report covers Medicare Supplement results and market trends for 2018, capturing sales and in-force data, claim trends and staffing, underwriting tools and practices, rate increase activity, compensation and distribution details. The comprehensive report is made available only to participating companies.
A total of 52 questionnaires were completed for this year’s survey, representing 84 companies with Medicare Supplement (Med Supp) business. Throughout this summary report, the percentage (or number) of companies refers to the 52 completed questionnaires. Depending on the type of question, not all companies were eligible to provide a response. To aid in your review, the number of responding companies is displayed as “R=.”
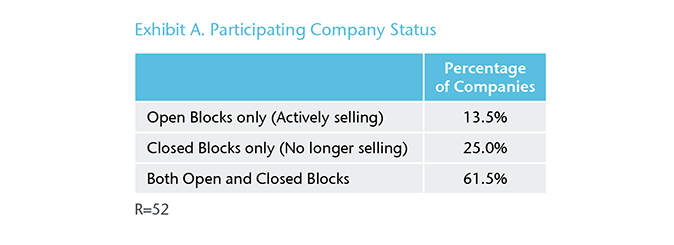
Participating companies were segmented by whether they have open and/or closed blocks of Med Supp business. “Open blocks” refers to blocks of business that accepted new applications in 2018. The majority of companies (61.5%) manage both open and closed blocks. (Exhibit A)
Total Annualized In-force Premium and Lives for 2018
Participating companies reported $24.2 billion of Med Supp in-force premium for 2018, representing an increase of 6.6% over 2017. When focusing on companies’ open blocks exclusively, in-force premium increases by 14.3%. (Exhibit B)

Total Annualized Sales Premium and Lives for 2018
In 2018, companies with open blocks reported just under $1.6 billion of Med Supp sales premium, representing a decline of 3.2% compared to 2017. Participants reported covering over 991,000 lives; a decline of 3.7% over 2017. (Exhibit C)

Source of Sales Premium and Lives
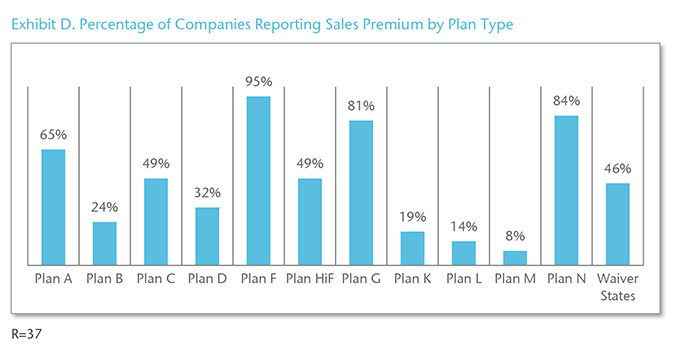
In 2018, Plan F was the most widely sold plan. Excluding two companies that sell only in waiver states, all participating companies sold Plan F. Plans G and N were also popular with over 80% of participants selling those plans. (Exhibit D)
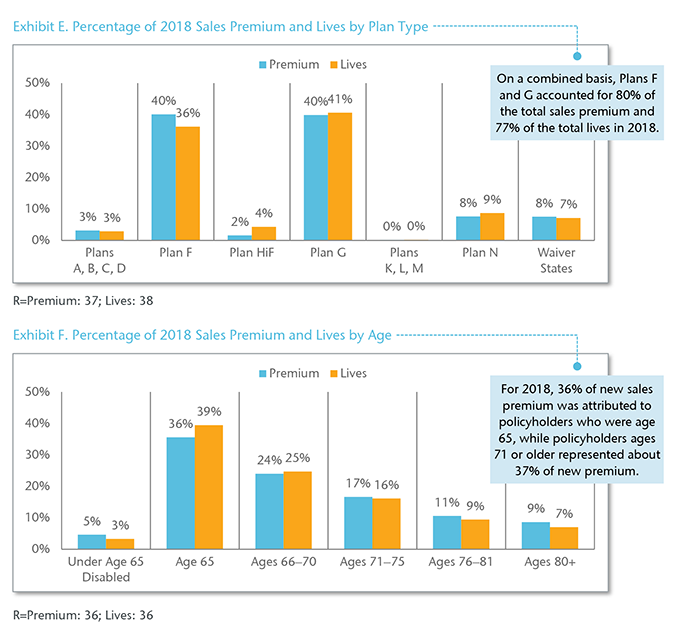
For 2017 and 2018, over 45% of the sales premium could be attributed to open enrollment applications. Sales premium from underwritten applications increased slightly, from 37.5% in 2017 to 38.5% in 2018. (Exhibit G)

2018 Claims Trend
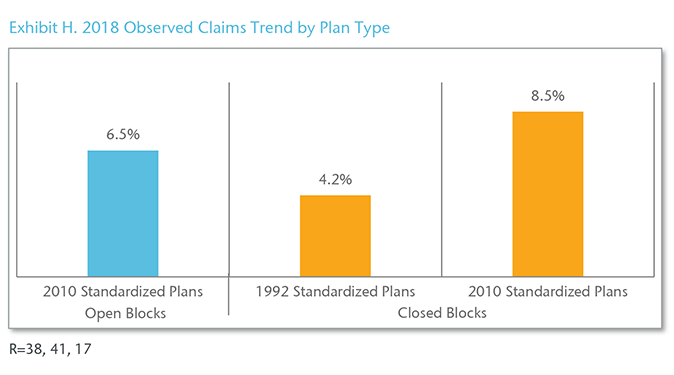
The observed claims trend for 2010 Standardized Plans averaged 8.5% for companies with closed blocks compared to 6.5% for companies with open blocks. (Exhibit H)
Lapse Rates
For 2018, the average lapse rate was 9.8% for open blocks and 14.7% for closed blocks. (Exhibit I) Compared to 2017, 47% of open blocks faced an increase and 44% experienced a decrease, while 60% of closed blocks experienced an increase.

Underwritten Applications (Open Blocks Only)
On average, 74.4% of underwritten applications were approved and placed, while 18.4% were declined. (Exhibit J) Of the 34 participating companies, 13 reported a decline rate of more than 20%.

Processing Time for Underwritten Applications (Open Blocks Only)
In 2018, the average turnaround time on underwritten applications was 4.4 business days. About 52% of the participating companies processed their underwritten applications in four days or less.
On average, participating companies keep an application open 34 days to obtain a requirement before closing it due to incomplete information. Over 60% of companies keep it open for 30 days or less.
For the purpose of this survey, an automated underwriting system was defined as a system to approve underwritten, web-based applications without human involvement. Of the 39 companies, 10 use an automated underwriting system and seven plan to implement a system within the next 24 months.
Distribution (Open Blocks Only)
Direct-to-consumer was defined as selling a Medicare Supplement policy over the phone, online, via mail or a combination of these methods without assistance from a traditional agent who is paid a traditional compensation. More than half of the participating companies currently sell direct-to-consumer, while 10% are looking to develop this capability. (Exhibit K)

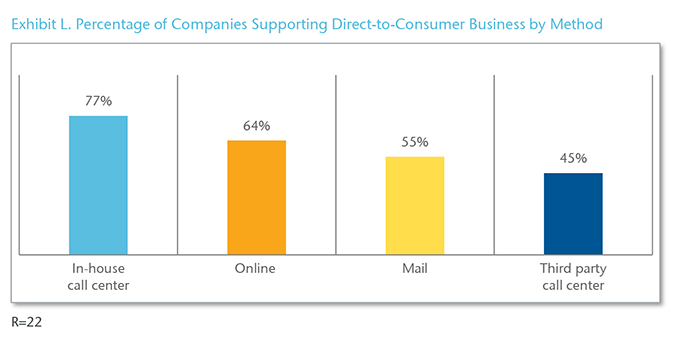
Most companies use an in-house call center as well as online support for their direct-to-consumer business. Sixteen companies reported using more than one method. (Exhibit L)
Download the PDF version for a list of participating companies.


