-
Property & Casualty
Property & Casualty Overview

Property & Casualty
We offer a full range of reinsurance products and the expertise of our talented reinsurance team.
Expertise
Publication
Structured Settlements – What They Are and Why They Matter
Publication
PFAS Awareness and Concern Continues to Grow. Will the Litigation it Generates Do Likewise?
Publication
“Weather” or Not to Use a Forensic Meteorologist in the Claims Process – It’s Not as Expensive as You Think
Publication
Phthalates – Why Now and Should We Be Worried?
Publication
The Hidden Costs of Convenience – The Impact of Food Delivery Apps on Auto Accidents
Publication
That’s a Robotaxi in Your Rear-View Mirror – What Does This Mean for Insurers? -
Life & Health
Life & Health Overview

Life & Health
We offer a full range of reinsurance products and the expertise of our talented reinsurance team.

Publication
Key Takeaways From Our U.S. Claims Fraud Survey
Publication
Favorite Findings – Behavioral Economics and Insurance
Publication
Individual Life Accelerated Underwriting – Highlights of 2024 U.S. Survey
Publication
Can a Low-Price Strategy be Successful in Today’s Competitive Medicare Supplement Market? U.S. Industry Events
Publication
The Latest in Obstructive Sleep Apnea -
Knowledge Center
Knowledge Center Overview

Knowledge Center
Our global experts share their insights on insurance industry topics.
Trending Topics -
About Us
About Us OverviewCorporate Information

Meet Gen Re
Gen Re delivers reinsurance solutions to the Life & Health and Property & Casualty insurance industries.
- Careers Careers
Measuring Underwriter Performance and Productivity – Solutions to an Ongoing Challenge

October 15, 2019
Keith Brown
English
I highly recommend Joseph W. Jordan’s book Living a Life of Significance for insurance professionals. It recognizes the importance of the roles of underwriters within the financial services industry.
The book jacket notes: “From Joe’s view of the world, we in the insurance industry earn our living in the noblest profession on earth.” Because underwriters play an essential role in this “noblest profession,” it is critical our service be consistently outstanding. A key to ensuring such consistency is for Underwriting departments to measure and manage performance and productivity without inappropriate bias.
It seemed to me that a guide to the specifics for achieving that goal would be useful because of how difficult it can be to appropriately measure underwriter performance and productivity in a positive manner that helps elevate underwriting department performance.
Management Biases to Avoid
As we work to optimally measure performance and productivity, it’s important to consider the impact of management biases, which can inappropriately shape a manager’s perception of an employee’s performance. For example, some biases unfairly benefit employees that a manager likes; conversely, they may punish the ones the manager dislikes. In other cases, a manager may give too much weight to a past or recent incident, to a positive or negative character trait, or to a good or bad previous rating. Bias can have a tremendously negative impact on company operations, with “punishment” taking many forms: lower compensation or missing out on promotions, important project work, industry conferences or client-facing events. It’s essential for underwriting professionals to understand potential managerial biases, to avoid them and their impact, and to collaborate on optimal performance and productivity measurement.
5 Common Types of Management Bias
1: Recency Effect
Management tends to focus on – or to overweight – the associate’s most recent performance, e.g., whether productivity was positive or negative in recent weeks or months.
- The employee’s rating recognizes recent improvement/ favorable performance.
Problematic aspects: A performance review that focuses solely on recent poor performance is not reflective of overall performance for the year and may result in demotivating an employee. By contrast, focus on recent successful productivity may result in an unmerited promotion or opportunities for advancement.
2: Spillover Effect
An associate’s performance rating is based primarily on past performance reviews. Management does not consider the employee’s recent performance improvement.
- The associate is undervalued for his or her overall performance.
Problematic aspects: Occurring repeatedly, this kind of review may be inaccurate and does not present a clear picture of the employee’s performance over the past year, which is demotivating for the employee and likely to result in a reduction of effort or loss of the employee altogether. Widespread practice of this kind of rating may result in generally low morale and lower productivity in the department.
3: Halo Effect
Management is positively impressed with an employee because of a single favorable trait or accomplishment.
- A manager’s rapport with an employee may be influenced by the employee’s “Schmoozer” personality, resulting in high ratings on all performance criteria, even if unmerited; rating items may be inappropriately blended together rather than independently assessed.
Problematic aspects: An associate receives feedback that isn’t helpful for their development and possibly receives unmerited advancement, which is detrimental to the company, department’s morale and retention of better qualified individuals.
4: Horn Effect (a.k.a., Pitchfork or Devil Effect)
The associate is unable to convince management that he or she is a high performer, despite evidence to the contrary.
- A brief incident of poor performance is followed by sustained stellar performance, but the evaluation focuses only on the former.
- Judgement of the associate’s performance is heavily influenced by employee friendships with average or low performers.
- The employee’s performance rating is entirely based on a manager’s perception of a negative character quality or feature.
Problematic aspects: These evaluations are artificially low performance ratings and are unmerited, unfair, and demoralizing for the employee. Again, this bias is detrimental to not only the individual but to the department’s morale and retention of qualified individuals.
5: Personal
As the term for this bias indicates, it emanates from a manager’s personal attitudes and opinions and prevents objective analysis of an employee’s performance and productivity.
- People whom the manager likes benefit from a positive review.
- People whom the manager dislikes are not rewarded and may get punished.
Problematic aspects: Similar to other biases, this one negatively impacts department operations by creating an unstable environment and demoralizing employees who are not within the manager’s circle of “liked” associates.
Common Examples of Management Bias

When reviewing an underwriter’s performance and productivity, traditional and non-traditional performance measurements are used by life insurers across the U.S.:
Traditional Measurements
- Completed New Business and Additional Mail Cases
- Placement Rates
- Time Service
- Medical Department Referrals
Non-Traditional Measurements
- Underwriting Consistency Studies
- Claims-Related Data
- Other Tests of Underwriter Consistency
Underwriter Performance Measurements
Factors that Skew Results
In each type of measurement, there are some factors that can skew results if inappropriately weighted. Here are some ways to ensure optimal performance measurements:
The Underwriters’ Range of Approval Authority and Average Face Amounts –
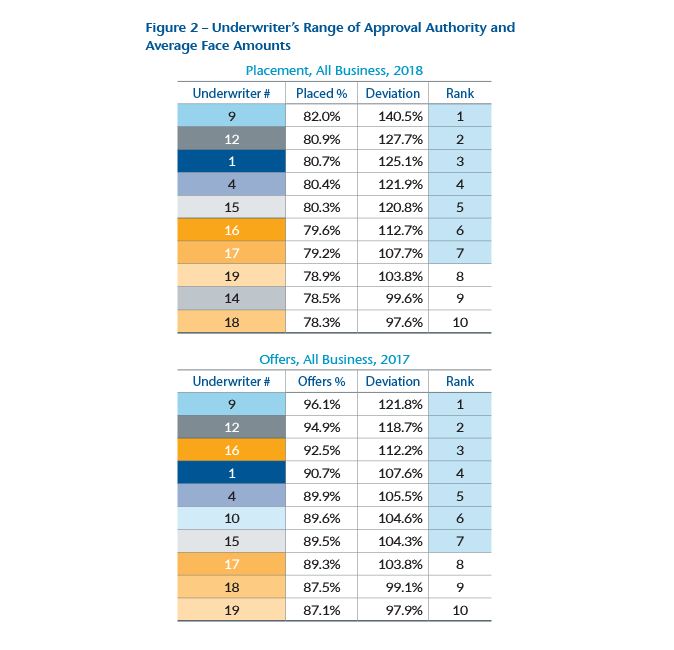
Compare underwriters with similar approval authorities and similar face amounts, because an underwriter handling on average $250,000 face amount cases may complete more cases than underwriters working on $5 million cases. In addition, an underwriter working on smaller face amounts may have a greater placement rate than underwriters whose average face amounts are higher. Time service can also be affected by comparing disproportionate face amounts as smaller face amounts may be underwritten more quickly than larger face amounts. (see Figure 2)
Average Proposed Insureds’ Ages –
Compare underwriters with cases of similar applicants’ ages, because an underwriter whose applicants’ average age is 29 may complete many more cases and have higher placement ratios than underwriters whose applicants’ average age is 79. Again, time service can vary due to the applicant’s age, too, with younger ages underwritten more rapidly than older ages. In addition, older applicants’ cases are expected to have more medical referrals than the younger applicants’ cases.
Production Sources of Business –
Is the underwriter’s work sourced from Captive, Brokerage, Personal Producing General Agent (PPGA), or Property & Casualty (P&C) agents or from new vs. experienced agents? Comparisons should be made using similar sources. Competitive brokerage business may necessitate more referrals to medical. Captive agents may be more familiar with company software, products, forms, and requirements so their business may lend itself to the faster completion of more cases than business from brokers, PPGAs or P&C agents, whose lack of familiarity with a company’s requirements and procedures may necessitate increased dialogue to complete underwriting. This also may be true for new agents versus experienced agents. Also, consider agent tenure for time service. If the agent’s tenure with your company is short, time service may lengthen because of the agent’s newness to the company. Short tenure may also mean more delays and back and forth with underwriters.
Example:
Consider two underwriters: One works exclusively with captive agents, another just with brokers. The latter may be at a disadvantage in terms of how much work he or she can complete compared to the former. Companies may assign some of their best underwriters to help new agents acclimate, yet performance metrics may not account for all the extra time required and the resulting negative impact on number of cases completed.
In addition to these ideas, we share insights on how to better utilize these extremely important data categories.
Traditional Measurements
Completed New Business and Additional Mail Cases
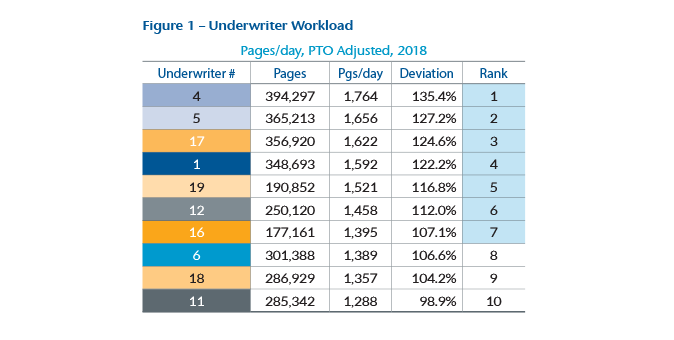
Many underwriting departments measure underwriter performance and productivity solely or largely on the number of tasks or on the number of underwriting cases completed each day. For example, with the load balancing and automatic case assignment functionalities of many underwriting workflow systems, it’s common for underwriting departments’ performance formats to assume that each underwriter gets the same daily workload, based on case numbers reviewed. (see Figure 1) However, that’s rarely the case at companies that do not take page count into consideration. Recommendations include:
- Continue to count cases completed per day and augment the measurement by counting underwriting file pages reviewed per day, adjusted for Paid Time Off (PTO), and compare both to peer underwriters and the entire department. Consider how you would determine who is more productive, the underwriter that reviewed 14 cases and 1,200 pages in a day or the one that reviewed 6 cases and 3,500 pages?
- Compare each underwriter to the entire department to see how the underwriter ranks, in addition to analyzing peer to peer. Extreme outliers merit additional attention: Why is one underwriter completing so few cases compared to his or her peers? Is the underwriter who is completing the most cases and pages per day doing a good job or going too fast?
- Underwriter’s Range of Approval Authority and Average Face Amounts (see Figure 2)
- Average Proposed Insureds’ Ages
- Production Sources of Business
Placement Rates
- Study offer rates – If peer underwriters are placing 60% and 40% of their cases respectively, what are the reasons for the dramatic difference? This analysis provides insights for helping underwriters with lower placement rates and for addressing those whose placement rate may be too high – a potential sign of being too liberal.
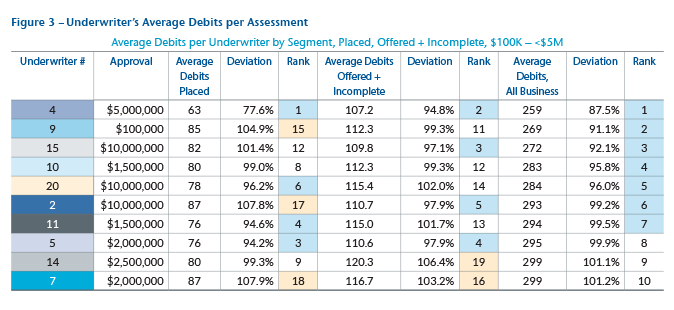
- Review average debits per underwriter assessment – What are the average debits on placed cases, on offers? What do the outliers tell you? (see Figure 3)
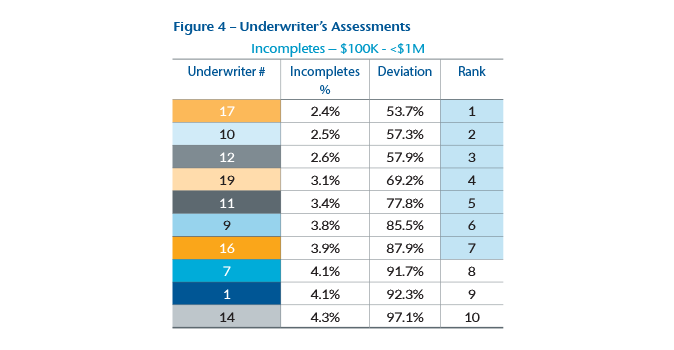
- Analyze assessments – (Preferred, Standard, Rated, Incomplete, Declined) and compare averages within approval authority ranges for peer underwriters and for the entire department. Focus on the outliers and address those as needed. (see Figure 4)
- Assess the percentage of cases per underwriter that are approved with amendments or delivery requirements – What does it tell you? Are some underwriters amending too much, others too little? What coaching opportunities does such information provide? Getting to the choicest environment with respect to amendments and out for signature requirements leads to the right balance between profitable placement and protective value.
- Range of Approval Authority and Average Face Amounts (see Figure 2)
- Average Proposed Insureds’ Ages
- Production Sources of Business
Time Service
- Measure underwriter’s “touches” with cases. Is an underwriter a good independent risk assessor? Or is decision-making a challenge, causing frequent back and forth with the medical department or co-signers, and/or asking for more and more underwriting requirements? Explore the number of medical referrals per underwriter in comparison to the department average. What does the data reveal?
- Account for projects and other non-production underwriting work that detracts from cases completed and time service.
- Analyze volume of phone calls received and made, and average call duration. Long and/or high-volume calls may indicate an underwriter is doing a great job working with agents, or the sales force has identified he or she as a strong go-to resource. Or, it may be a sign of someone just spending too much time talking on the phone. Are the involved phone numbers business-related or unrelated? How do the metrics compare to overall department averages? Dig into the extreme outliers.
- Study the time of day assessment messages are sent and intervals between messages. Are underwriters working consistently within service expectations or are there unusual gaps in service? This is particularly important with remote underwriters.
- Inspect internet usage and sites visited. Are searches work related? What is the average time per underwriter per week or month spent searching? How does that compare to the department average? Again, inspect the outliers.
- Range of Approval Authority and Average Face Amounts (see Figure 2)
- Average Proposed Insureds’ Ages
- Production Sources of Business
Medical Department Referrals
Overall aspects to consider in addition to time service include:
- Number of cases underwriters send for review
- A peer comparison
- Department comparison – What do outliers tell you? Is high volume due to the nature of the medical histories, and/or size of risks, or lack of skills? Does low volume indicate the underwriter knows what he or she is doing – or doesn’t want medical directors to see their work?
- Tracking underwriter-recommended rating compared to medical rating – This analysis is infrequently seen but invaluable. If a method isn’t in place to study underwriters’ pre-referral assessments compared to those returned from medical, useful insight into underwriter performance is being missed. Without such information, an underwriter can score very well on underwriting reviews even if he or she isn’t performing appropriate risk assessments because the medical staff corrects underwriting errors before final assessments are communicated.
- Medical department feedback on assessment write-up quality – Doctors are a helpful source of feedback on the quality of case write-ups and assessments. Seek their opinions periodically; however, be attuned to potential biases if friction exists between an underwriter and a medical director.
- Average number of words per assessment write-up – Compare peers’ and overall department metrics. The counting should be automated. It provides valuable information for coaching on case write-ups. Intelligently streamlining assessment write-ups positively impacts the number of cases completed, time service and placement.
- Range of Approval Authority and Average Face Amounts (see Figure 2)
- Average Proposed Insureds’ Ages
- Production Sources of Business
Underwriter Reviews
- “Audits” vs. “Reviews” – The word “reviews” has more positive connotations and resonates better with underwriters than “audits.”
- The Reviewer – Who conducts the reviews is important: chief, more senior underwriter, dedicated reviewer, medical director? A team of dedicated reviewers is optimal, rotating which underwriters they review. This yields consistency of approach, while exposing underwriters to different reviewers. Make sure the reviewers’ skills and philosophies align with the department. Consult medical directors for questions and challenging cases.
- Peer Reviews – Companies with small staffs often use peer reviews; however, from our experience, it’s a mistake. Having a peer, who may be a friend, can result in hiding or sugar-coating underwriting performance deficiencies. If your staff faces this challenge, consider engaging reinsurers to perform your reviews; this approach can yield the best results in place of peer reviews.
- Biases – Be aware of bias the reviewers may have and their potential impact on the review process.
- Output Sample – Make sure the sample is big enough and contains a mix of ages, medical and nonmedical histories, and underwriting decisions. Study Preferred, Standard and Rated issues as well as Declines and Incompletes. Much can be learned from each category.
- MIB Coding – As it is an important part of an underwriter’s role, make it part of the review process as an educational component rather than deducting points from an overall review score. Review scores are best when they consist of risk assessment factors rather than a mix of risk assessment factors and administrative aspects with no material bearing on the risk assessment.
- Age / Amount Requirements – These requirements are central to any review to ensure the appropriate requirements are being obtained.
- Passing Threshold – The suggested goal is 97% accuracy rate with minimum passing threshold 95%. We’ve seen some in the 80% range and don’t think it’s in a carrier’s best interests. Also, the lower the thresholds, the more negative the impact to reinsurance pricing may be.
- Discordant Score – Gen Re suggests calculating premium discordance for errors. For example, three errors made on a review of policies with a total combined risk of $150,000 and five tables worth of discrepancy, may have less impact on company profitability than one error made on a $5 million policy issued at Standard that should have been rated Table 8. Discordant score is a way to understand the financial impact of errors and improve the insights provided by reviews.
- Department Rank – Ideally, all the underwriters will meet or exceed their goal. Seeing where they rank in the overall department can be helpful to goal setting, identifying training needs and performance reviews.
- Education – Use the review process to provide educational assistance to the underwriters. Don’t unfairly reduce scores for administrative task errors that have no bearing on risk assessments. We recommend working with underwriters to eliminate administrative errors, rather than involving a punitive component.
- Automated Process – Systems should be in place to prevent an underwriter from issuing a case above his or her approval authority. At a minimum, an error report should be quickly generated for management to address it. An automated review process could analyze whether all published age and amount requirements were obtained prior to issue and whether appropriate medical reviews and co-signatures were obtained. Having this automation in place can reduce the manual tasks associated with underwriter reviews, and risk officers gain comfort knowing each case goes through a review process.
Claims-Related Data
- Loss ratio (claims paid out as a % of premium earned over same time period) per underwriter – Be cautious with sharing claims information with production underwriters as doing so can inhibit tough decision-making or prompt overly conservative underwriting. Understanding this data is important for management; using it appropriately is essential.
- Claim frequency per underwriter (expected vs. actual claims / underwriter) – Data scientists can help design this analysis. Again, this is more of a measurement for management than for sharing with underwriters.
- Tenure – Compare underwriter tenure ranges: 3, 5, 10 years, etc.
- Patterns – Look for patterns that reveal otherwise unnoticed information.
- Range of Approval Authority
- Production Sources of Business
Non-Traditional Measurements
Underwriting Consistency Studies
Design or identify a group of underwriting cases that present challenging or core medical, nonmedical, and financial underwriting scenarios.
- Ask each underwriter to assess the risks independently in a fixed period of time to check accuracy and consistency.
- From the review, explore if the underwriter understands well and adheres to the underwriting manual and company guidelines.
- Consider similar evaluations of medical directors because it’s important to ensure consistency between all parties.
- The findings of these recommendations are a great way to identify training needs.
Other Underwriter Performance Metrics to Consider
- Agent/Agency retention – If you assign certain underwriters to certain production sources, study agent/agency retention rate per underwriter. Retention is not solely due to underwriting service, but an underwriter whose retention rate is much lower than the department average may have performance issues or training needs.
- Expense per application underwritten – Evaluate this expense in terms of a department average per case, and then digging deeper, look at peers working on similar types of business, with similar approval authorities. An underwriter with a higher-than-average underwriting expense per case may be ordering too many requirements and struggling to make decisions, or it may be a sign of an underwriter going the extra mile to try and find a way to place business. Either way, understanding the cause is helpful in performance management.
- Persistency per underwriter – Understanding his/her persistency helps provide insight into an underwriter’s financial underwriting skills and identifies training opportunities.
- Annual placed volume and premium per underwriter – Review this count. As we noted at the beginning of this publication, many underwriting departments focus on cases or tasks completed and reward high volumes. Consider who is more valuable to a company, the underwriter who handles a smaller number of cases but profitably places a high percentage of the company’s business, or the underwriter who completes a high number of applications or application related tasks but places little business?
- However, the performance review should be considered in the context of revenue influencers:
- Great vs. poor agent sales service skills
- Great vs. poor agent or company customer service
- Product competitiveness and investment performance
Performance Review Checklist
In Summary
Good underwriters are valuable assets. Having an outstanding underwriting team is essential for companies’ successes. Being able to appropriately define and identify “outstanding” performance and productivity through metrics is an ongoing challenge, but putting the right metrics into play and understanding managerial biases are cornerstones of such a process.
I wrote this guide because of an awareness of how difficult it can be to appropriately measure underwriter performance and productivity in a positive manner that helps elevate underwriting department performance. Hopefully some content will resonate with readers, and we’ll be able to improve the process together.


