-
Property & Casualty
Property & Casualty Overview

Property & Casualty
We offer a full range of reinsurance products and the expertise of our talented reinsurance team.
Expertise
Publication
Structured Settlements – What They Are and Why They Matter
Publication
PFAS Awareness and Concern Continues to Grow. Will the Litigation it Generates Do Likewise?
Publication
“Weather” or Not to Use a Forensic Meteorologist in the Claims Process – It’s Not as Expensive as You Think
Publication
Phthalates – Why Now and Should We Be Worried?
Publication
The Hidden Costs of Convenience – The Impact of Food Delivery Apps on Auto Accidents
Publication
That’s a Robotaxi in Your Rear-View Mirror – What Does This Mean for Insurers? -
Life & Health
Life & Health Overview

Life & Health
We offer a full range of reinsurance products and the expertise of our talented reinsurance team.

Publication
Key Takeaways From Our U.S. Claims Fraud Survey
Publication
Favorite Findings – Behavioral Economics and Insurance
Publication
Individual Life Accelerated Underwriting – Highlights of 2024 U.S. Survey
Publication
Can a Low-Price Strategy be Successful in Today’s Competitive Medicare Supplement Market? U.S. Industry Events
Publication
The Latest in Obstructive Sleep Apnea -
Knowledge Center
Knowledge Center Overview

Knowledge Center
Our global experts share their insights on insurance industry topics.
Trending Topics -
About Us
About Us OverviewCorporate Information

Meet Gen Re
Gen Re delivers reinsurance solutions to the Life & Health and Property & Casualty insurance industries.
- Careers Careers
Solvency Capital Requirement – A Look Behind the Curtain

October 05, 2016
Christian Tomberg
Region: Europe
English
As outlined in our blog, “Why We Must Be Rational When Comparing Solvency Ratios,” it is not a trivial task to “just” compare the final percentages of the Solvency Ratios according to Solvency II (SII). In the second part of this series, we aim to provide you with some more insight into how modelling approaches and valuation options influence the denominator of the Solvency Ratio, i.e. Solvency Capital Requirement (SCR). This might help to avoid a number of pitfalls when comparing SCR numbers.
Pitfall 1: Differing Modelling Approaches
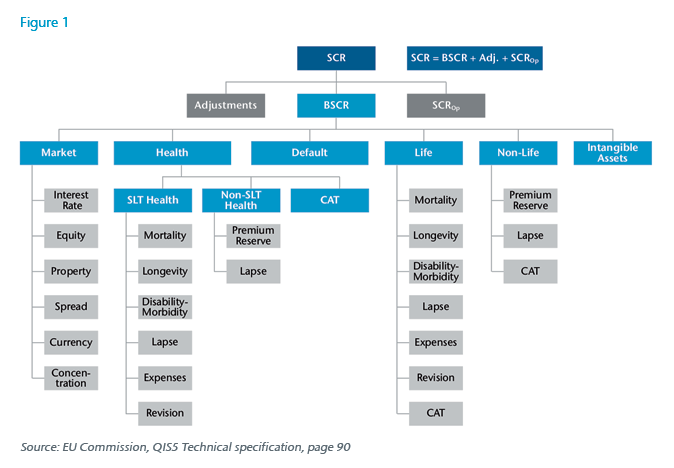
The starting point for any SCR calculation is the SII Risk Tree:
There are, however, four general approaches how to calculate the SCR according to Solvency II:

The default approach is the Standard Formula (SF). When a company or the regulator considers the SF not to be the appropriate choice, a more complex approach can be selected in order to better reflect the underlying risk profile. One has to realize, though, that the often cumbersome and costly road of the Internal Model Approval Process is only chosen if a relevant positive impact on the overall SCR is expected. Furthermore, such an alternative approach reduces comparability across companies.
Example
Let’s take an average Property/Casualty insurance company. According to the Standard Formula, Market risks and Non- Life underwriting risks are slightly positively correlated.
If this single assumption was changed in an Internal Model, and Market and Non- Life underwriting risks were assumed to be uncorrelated instead, the SCR and the Solvency Ratio would change significantly. In this case – by changing one isolated assumption only – the Solvency Ratio could easily increase, for instance, from 200% to 222%. The breakdown of the SCR according to the Standard Formula for this company and the impact of this hypothetical Internal Model are illustrated below.
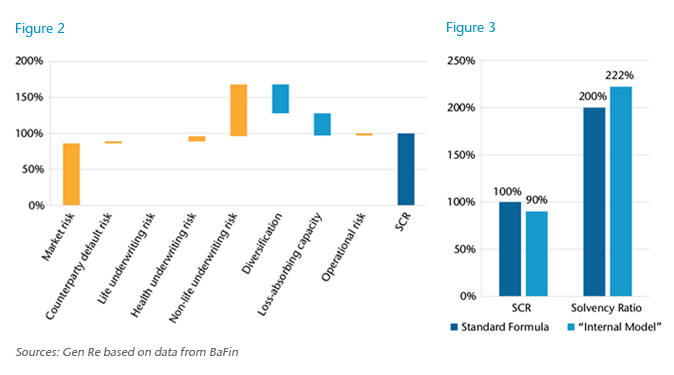
While this example might be a bit of a simplification, it underscores that Solvency Ratios can only be comparable if the SCR calculation is based on the SF.
Pitfall 2: Valuation Options
Even if only the SF is used, it might be misleading to compare the resulting SCRs directly. In fact, there is no one-and-only SF, as the SF itself allows for certain valuation options. For example:
- As part of the transitional measures, there is the option to adjust certain inputs and parameters to allow for a phase-in of Solvency II. For instance, there are measures to adjust the technical provisions, the risk-free interest rates and the equity risk charge. While the first two transitional measures primarily affect the SII balance sheet, they can also have a material secondary effect on the SCR.
- Articles 89 to 112 of the Solvency II Directive allow for a wide range of simplifications within the Standard Formula. There are simplifications for most of the life and health underwriting risk modules, for Selected Market and Non-Life risks modules and for captives’ insurance undertakings. For example:
- The mortality and longevity risk modules can be approximated by using an average mortality rate instead of a complete mortality table.
- For spread risk modules, a duration-based approach is applicable if a complete valuation is not proportional.
- For captives the interest rate risk module can be approximated based on duration bands instead of calculating explicit interest rate shocks.
- The method used to establish a consolidated group SCR can lead to quite different outcomes. The “Consolidation” method (default method) is based on a consolidated balance sheet, while the “Deduction and Aggregation” method uses the SCR results of the individual entities. Moreover, the local capital requirement can be used for a subsidiary incorporated in a country outside of the EU in the “Deduction and Aggregation” method, if the country has been assigned “equivalence” to SII. This illustrates that the outcomes of both methods are hardly comparable.
As a result, even the outcome of an SF approach can only be compared if the same valuation options are being used.
Pitfall 3: Design of the Standard Formula
Yet even if the same valuation options are used, comparing SCR results might be misleading as some modules in the Standard Formula are comparatively conservative while other modules are relatively aggressive as illustrated by the following two examples:
Market Risk
Assume you had the choice to invest EUR 100m in one of the following three investments:
- 10-year Greek Government Bonds
- A diversified European Real Estate portfolio
- The Euro Stoxx 50 equity index
According to the SF, however, the following market risk SCR charges would apply:
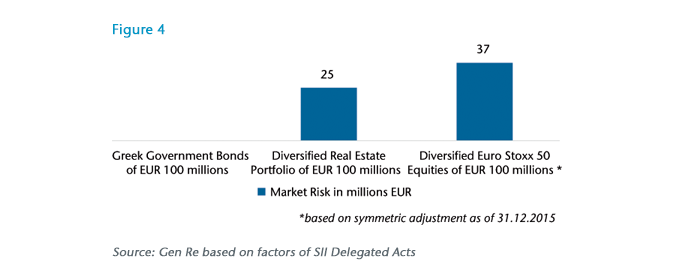
Would these charges reflect the relation of the risks underlying these three investments? Especially if you compare the risk charge for the equity portfolio to the risk charge for the Greek government bond portfolio, there is no doubt that the basis for these assessments is not comparable. For a proper risk assessment of the real estate risk, further information about the actual portfolio would be required, such as the location of the property, whether it is commercial or residential, the number of buildings in the portfolio, etc. This information, however, is not reflected in the real estate charge. A similar argument can be made for the equity risk. As both risk charges reflect only selected aspects of the underlying portfolio, there might be cases where the relation is appropriate and others where it is highly misleading.
Therefore, one should not rely on the SCR alone for a proper assessment of the market risk. Instead, the actual investment portfolio and risk management framework would need to be assessed in more detail.
Non-Life Catastrophe Risk
The SF differentiates between Natural Catastrophe Risk, Man-Made Catastrophe Risk, Catastrophe Risk for Non-Proportional Property Reinsurance and Other Catastrophe Risk.
As an example, we as reinsurer consider the Natural Catastrophe sub-module for certain areas, particularly conservative, based on both our internal Nat Cat models and Nat Cat models provided by external model firms.
Similar arguments can be raised for other submodules of the Non-Life Catastrophe Module. The Catastrophe Risk for Non-Proportional Reinsurance sub-module, for example, is solely premium-based, regardless of the layer structure of the reinsurance contracts. Depending on the attachment point of the non-proportional reinsurance treaty or the actual exposure covered, this can be either conservative or aggressive as laid out in the example below.
Assume we have four excess of loss treaties with the same priority but different layers. The probable maximum loss might be proportional to the excess cover granted, though the premium might not be as laid out in the Table 1.

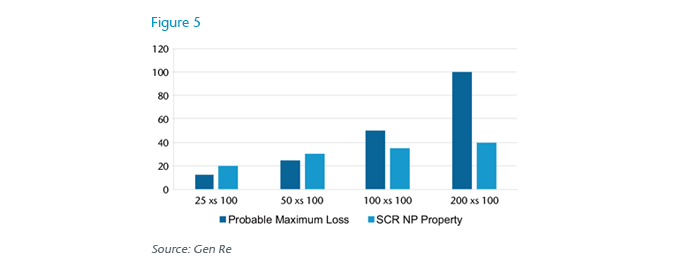
In this case, the Standard Formula would be conservative for lower layers and more aggressive for higher layers.
For the remaining modules in the SF (i.e. Life, Health, Default and OpRisk) as well as for the aggregation, similar examples show that the SF is sometimes not only risk adequate but can even be conservative. As a consequence, the SCR derived by the SF is more conservative for certain business mixes than for others.
For regulatory purposes, additional cushion in the overall SCR should be acceptable as it ensures that sufficient capital is provided per company. For investors, clients and the wider public, however, this aspect makes a comparison of the overall SCR results quite challenging.
Conclusion
As laid out in the examples above, taking only one single number into account – the overall SCR – is prone to misinterpretations due to differing model approaches, valuation options and the design of the Standard Formula itself. It is correct that the SCR adds a new perspective to the company’s risk profile; nevertheless, one should avoid turning a blind eye on well-established financial market information. We therefore encourage you to dig deeper and include further quantitative and qualitative information in your comparison, such as external ratings, published financial reports, the organizational structure and the company’s management.


