-
Property & Casualty
Property & Casualty Overview

Property & Casualty
We offer a full range of reinsurance products and the expertise of our talented reinsurance team.
Expertise
Publication
Florida Property Tort Reforms – Evolving Conditions
Publication
Is Human Trafficking the Next Big Liability Exposure for Insurers?
Publication
When Likes Turn to Lawsuits – Social Media Addiction and the Insurance Fallout
Publication
Generative Artificial Intelligence and Its Implications for Weather and Climate Risk Management in Insurance
Publication
Engineered Stone – A Real Emergence of Silicosis
Publication
Who’s Really Behind That Lawsuit? – Claims Handling Challenges From Third-Party Litigation Funding -
Life & Health
Life & Health Overview

Life & Health
We offer a full range of reinsurance products and the expertise of our talented reinsurance team.

Publication
Understanding Physician Contracts When Underwriting Disability Insurance
Publication
Voice Analytics – Insurance Industry Applications [Webinar]
Publication
GLP-1 Receptor Agonists – From Evolution to Revolution U.S. Industry Events
Publication
Always On: Understanding New Age Addictions and Their Implications for Disability Insurance
Publication
Dying Gracefully – Legal, Ethical, and Insurance Perspectives on Medical Assistance in Dying -
Knowledge Center
Knowledge Center Overview

Knowledge Center
Our global experts share their insights on insurance industry topics.
Trending Topics -
About Us
About Us OverviewCorporate Information

Meet Gen Re
Gen Re delivers reinsurance solutions to the Life & Health and Property & Casualty insurance industries.
- Careers Careers
Individual Disability – Results of 2020 U.S. Market Survey

May 10, 2021
Lisa Bolduc
Region: North America
English
Gen Re Research Center in North America is pleased to share results from its U.S. Individual Disability Market Survey, an industry benchmarking study covering Non‑Cancelable (Non‑Can), Guaranteed Renewable (GR), Buy‑Sell, and Guaranteed Standard Issue (GSI) product lines for 2019 and 2020.
Sixteen carriers participated in the survey representing $5 billion of in‑force premium. Of those companies, 15 reported Non‑Can results, 14 GR results and seven reported on their Buy‑Sell product. Eight companies reported Non‑Can GSI results, and five companies reported GR GSI results. (List of participating companies is in the PDF.)
Growth calculations for 2019 to 2020 are based upon those companies providing survey data for both years and include any adjustments made to the 2019 reported data.
Market Growth – New Business
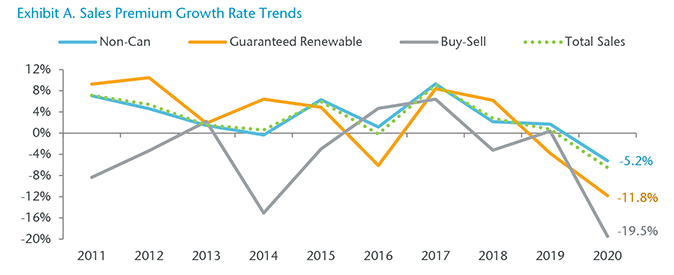
Total new sales premium from Non‑Cancelable, Guaranteed Renewable and Buy‑Sell combined declined by nearly 7% to $398.9 million in 2020. Non‑Can sales premium was down 5% and GR sales premium decreased by 12%. Buy‑Sell sales fared the worst, falling by almost 20%. (Exhibit A)
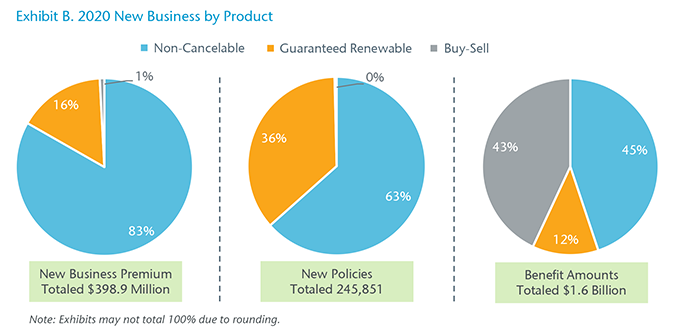
Of the $398.9 million in total new sales premium, Non‑Can products represent 83% or $332.1 million, and GR represents 16% or $63.5 million. Buy‑Sell accounts for less than 1% of new sales premium and policies yet represents 43% of the total new benefit amounts in 2020. (Exhibit B)
The number of new policies issued declined by 11%; from over 275,000 in 2019 to 245,851 in 2020. Total benefit amounts fell by more than 10% to $1.6 billion.
Market Growth – In‑force Business
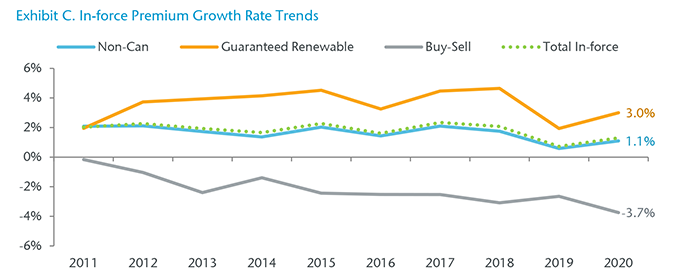
Total in‑force premium from Non‑Cancelable, Guaranteed Renewable and Buy‑Sell combined was up 1.3% to $5 billion in 2020. Non‑Can was fairly level at 1%, GR increased 3%, while Buy‑Sell fell nearly 4%; posting negative results for the 12th consecutive year. (Exhibits C)
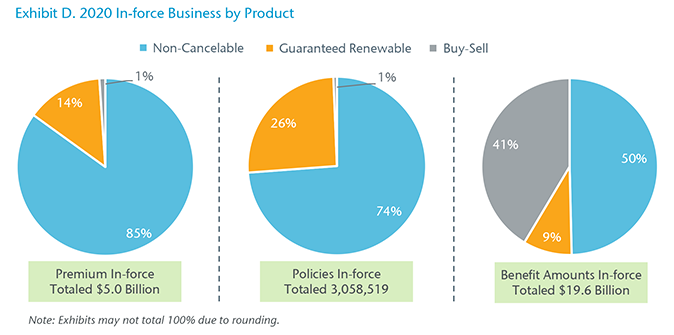
Of the $5 billion in total in‑force premium, Non‑Can products represent 85% or $4.3 billion, and GR represents 14% or $701.3 million. As with new sales, Buy‑Sell accounts for 1% of in‑force premium and policies but accounts for 41% of the total benefit amounts in 2020. (Exhibit D)
The number of in‑force policies remained level at 3.1 million, as did the total benefit amount, remaining at $19.6 billion.
Market Growth – Guaranteed Standard Issue Business
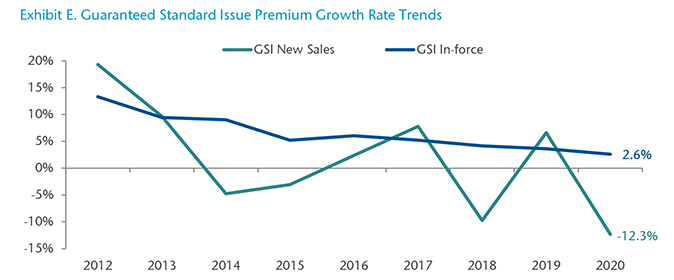
Total GSI new sales premium (Non‑Can and GR combined) declined by more than 12% to $47.9 million in 2020. Non‑Can GSI, which accounts for 98% of the total, fell 12.2% to $46.9 million, while GR GSI fell 16.5% to just under $1 million. Total GSI in‑force premium grew by 2.6% to $402.8 million. (Exhibit E)
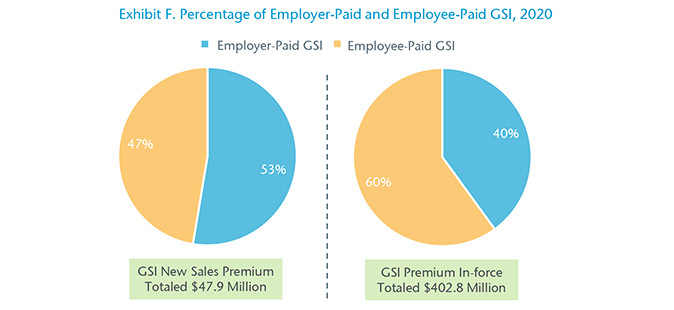
Of the total GSI new sales premium, employer-paid accounts for $25.2 million (53%) and employee-paid accounts for $22.7 million. (Exhibit F)
Non‑Cancelable – New Business
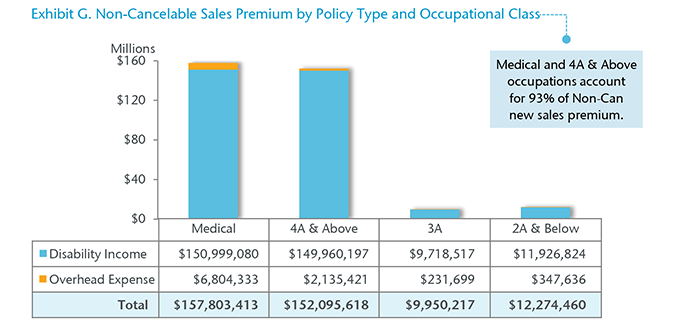
Participating companies reported $332.1 million of Non‑Cancelable new sales premium. Disability Income (DI) represents $322.6 million or 97% and Overhead Expense (OE) accounts for $9.5 million. (Exhibit G)
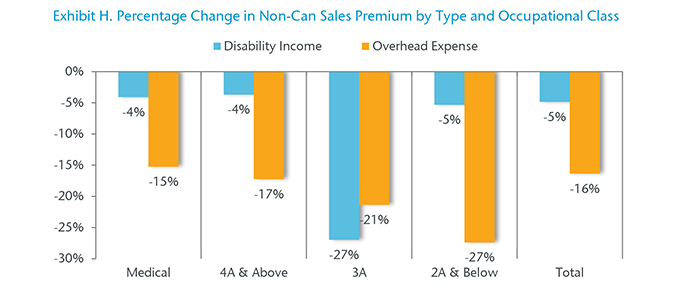
Overall, Non‑Can new sales premium declined by 5%; DI fell 5% and OE sales premium fell 16%. DI premium from the 3A occupational category went from $13.3 million in 2019 to $9.7 million in 2020; a decrease of 27%. OE premium from the 3A and 2A & Below occupational categories decreased 21% and 27%, respectively. (Exhibit H)
Non‑Cancelable – In‑force Business
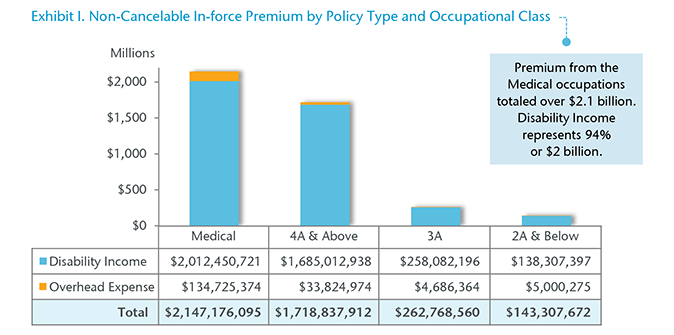
Participating companies reported $4.3 billion of Non‑Cancelable in‑force premium. DI represents $4.1 billion or 96% and OE accounts for the remainder. (Exhibit I)
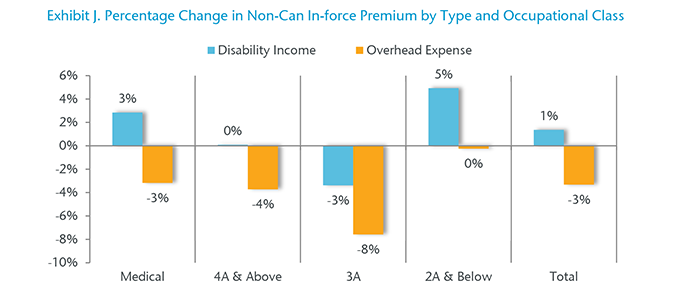
Non‑Can in‑force premium from DI grew 1%, mainly due to the Medical and 2A & Below occupational categories increasing by 3% and 5%, respectively. In‑force premium from OE policies fell 3%, with all occupational classes declining. The 3A class fared the worst with premium falling by 8%. (Exhibit J)
Non‑Can Guaranteed Standard Issue – New Sales and In‑force Business
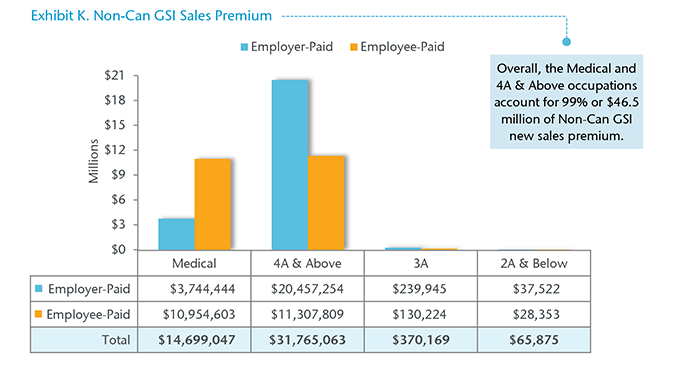
Participating companies reported $46.9 million of Non‑Can GSI sales premium, decreasing 12% compared to 2019. Employer‑paid premium accounts for $24.5 million (52%) and employee‑paid premium accounts for $22.4 million. (Exhibit K)
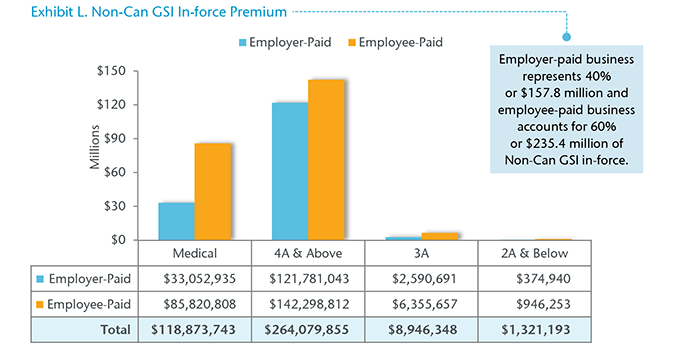
For 2020, eight companies reported $393.2 million of Non‑Can GSI in‑force premium; an increase of 3% over 2019. Premium from 4A & Above occupations, which accounts for 67% of the total, increased 4% to $264.1 million, while premium from the 2A & Below occupations decreased 11% to $1.3 million. (Exhibit L)
Guaranteed Renewable – New Business
Participating companies reported $63.5 million of GR new sales premium, a decline of 12% over 2019. DI accounts for nearly all at $63.3 million, while OE premium represents less than $200,000. (Exhibit M)
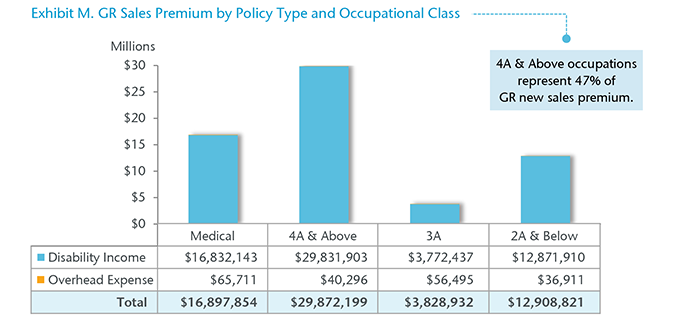
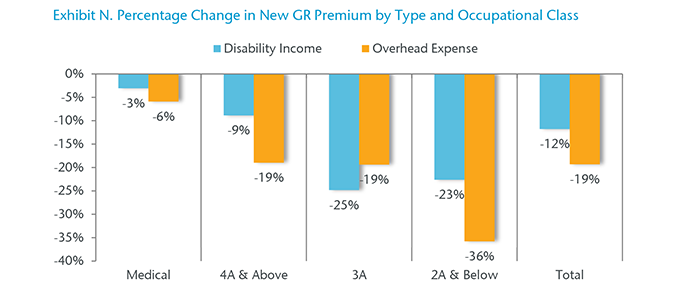
GR new sales premium from DI and OE declined 12% and 19%, respectively. Overall, premium from the 3A occupational class fell 25%; DI declined 25% and OE fell 19% in 2020. (Exhibit N)
Guaranteed Renewable – In‑force Business
Participating companies reported $701.3 million of Guaranteed Renewable (GR) in‑force premium, up 3% over 2019. Disability Income accounts for $696.3 million or 99%. (Exhibit O)
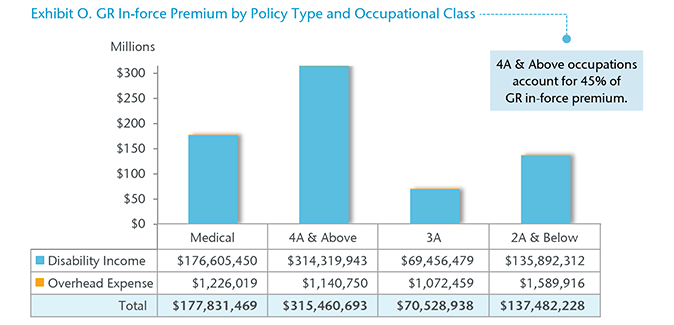
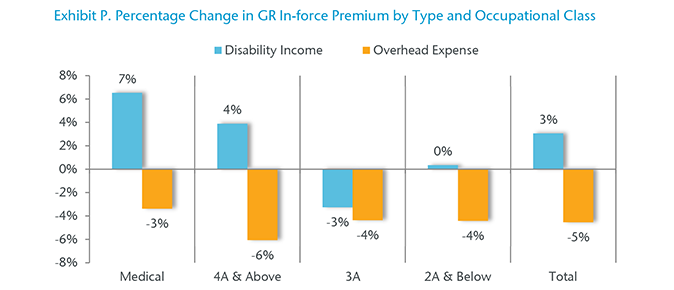
GR in‑force premium from DI grew 3%, with the Medical and 4A & Above occupational categories increasing by 7% and 4%, respectively. In‑force premium from OE policies fell 5%, with all occupational classes declining. (Exhibit P)
GR Guaranteed Standard Issue – New Sales and In‑force Business
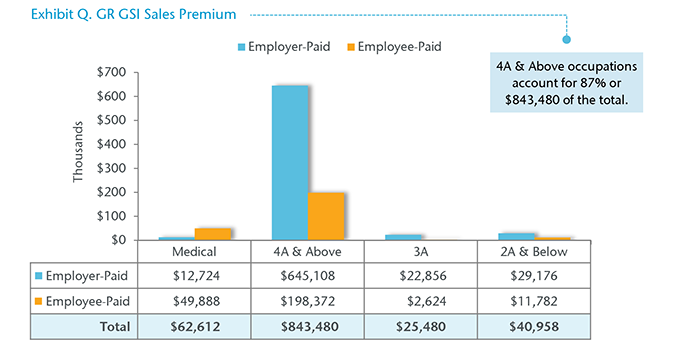
Participating companies reported $972,530 of GR GSI new sales premium, falling 17% compared to 2019. Overall, employer-paid business accounts for 73% or $709,864, while employee-paid business represents 27% or $262,666. (Exhibit Q)
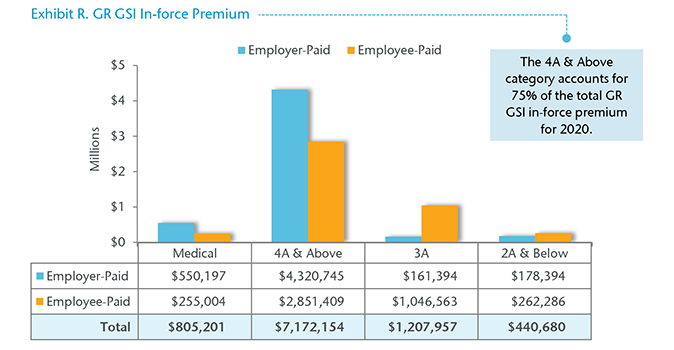
Five companies reported over $9.6 million of GR Guaranteed Standard Issue in‑force premium for 2020, a decline of 7% compared to 2019 results. Employer-paid premium represents 54% or $5.2 million and employee-paid accounts for 46% or $4.4 million. (Exhibit R)
Buy‑Sell – New Sales and In‑force Business
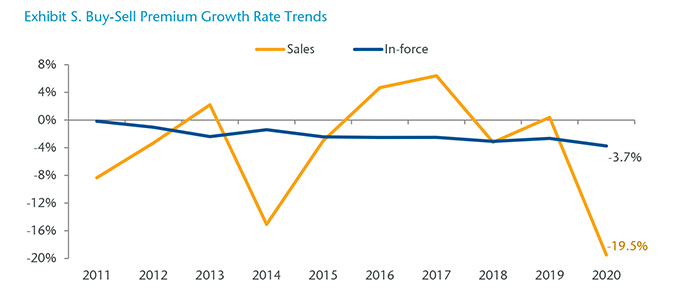
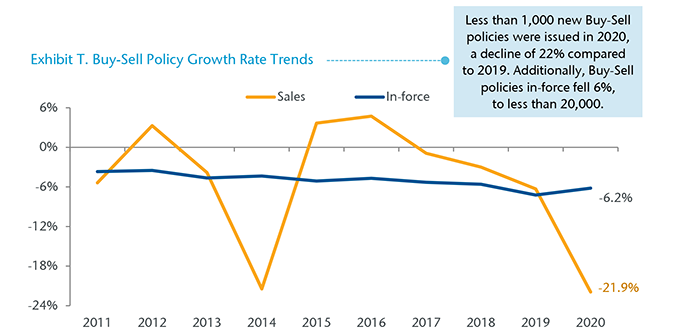
Seven companies reported over $54.8 million in Buy‑Sell in‑force premium; declining by 4% compared to 2019. Results for new sales premium has been more volatile, falling nearly 20% from $4.1 million in 2019 to $3.3 million. (Exhibit S)
Survey Takeaways
For the 16 companies that participated in our survey, here are their highlights including Non‑Cancelable, Guaranteed Renewable, and Buy‑Sell products combined:
- Total sales premium declined 6.5% to $398.9 million in 2020
- Total number of new policies issued declined 10.8%
- Total in‑force premium reached $5 billion in 2020 (up by 1.3%)
- Total policies in‑force were level at 3.1 million (down by ‑0.4%)
- Total benefit amounts in‑force were level at $19.6 billion (down by ‑0.2%)
- Non‑Cancelable represents $4.3 billion (85%) of total in‑force premium
- Guaranteed Renewable in‑force premium reached $701.3 million (up by 3%)
- Buy‑Sell in‑force premium declined -3.7%, a negative result for the 12th consecutive year.
Keep an eye out for a blog by Steve Woods on his view of what these results mean to carriers.


