-
Property & Casualty
Property & Casualty Overview

Property & Casualty
We offer a full range of reinsurance products and the expertise of our talented reinsurance team.
Trending Topics
Publication
That’s a Robotaxi in Your Rear-View Mirror – What Does This Mean for Insurers?
Publication
Cat Bonds – A Threat to Traditional Reinsurance?
Publication
Decision-Making in the Age of Generative Artificial Intelligence
Publication
Buildings Made of Wood – A Challenge For Insurers?
Publication
The CrowdStrike Incident – A Wake-Up Call for Insurers?
Publication
PFAS Awareness and Concern Continues to Grow. Will the Litigation it Generates Do Likewise? -
Life & Health
Life & Health Overview

Life & Health
We offer a full range of reinsurance products and the expertise of our talented reinsurance team.
Training & Education
Publication
When Actuaries Meet Claims Managers – Data-Driven Disability Claims Review
Publication
Chronic Pain and the Role of Insurers – A Multifactorial Perspective on Causes, Therapies and Prognosis
Publication
Fasting – A Tradition Across Civilizations
Publication
Alzheimer’s Disease Overview – Detection and New Treatments
Publication
Simplicity, Interpretability, and Effective Variable Selection with LASSO Regression Moving The Dial On Mental Health
 -
Knowledge Center
Knowledge Center Overview

Knowledge Center
Our global experts share their insights on insurance industry topics.
Trending Topics -
About Us
About Us OverviewCorporate Information

Meet Gen Re
Gen Re delivers reinsurance solutions to the Life & Health and Property & Casualty insurance industries.
- Careers Careers
Detecting Fraudulent Claims – A Machine Learning Approach

February 29, 2020
Dr. Behrang Jalali
English
Chinese
Insurers can demonstrate their solidity and quality through outstanding claims management. This part of the insurance process has a fundamental impact not only on the insurer’s profitability but also on the customers’ satisfaction. Distinguishing between valid and fraudulent claims effectively and efficiently is one way to ensure the financial strength of insurance companies and consequently enable them to optimally compensate and support customers.
Health insurance fraud, for example, creates significant costs and extra work for insurers around the world. Not only does it lead to delays in processing and payments for the customers, but undetected fraud also adds to premium increases for the honest customers.
Advances in technology are allowing new types and a different scale of fraudulent behaviours to evolve. To enhance fraud detection and prevent loss from those developments, we can collaborate with claims experts to implement various data analytics strategies that monitor claims and update business rules that help identify suspicious claims.
According to the European Insurance and Occupational Pensions Authority (EIOPA), after pricing and underwriting, claims management (including fraud prevention) is the largest area of the insurance value chain in which analytics applications, particularly machine learning, can be beneficial.
The increasing use of sensors and mobile phones means collecting and linking data from various sources is becoming the norm, and all this digitalization is also making it easier for the insured to make claims frequently. Big data technologies and modern methodologies can optimize processing systems and support claims departments.
This article describes the use of analytics in health insurance. We carry out modelling of fraudulent claims in the context of a health claims portfolio. Due to the rare phenomena to be modelled, the selection of algorithms, tuning parameters and choosing the optimum threshold in this classification task is of the utmost importance. We show why this should be an iterative process and requires a dialogue between analytics experts and claims managers.
The data and the business task
In our data, there are nearly a million claims records with more than 20 variables. Among the variables are:
- Personal attributes, such as age, age at claim and gender
- Claims characteristics, such as claims history (multiple claims), minor or major claims, claims via single or multiple products and claims amount
- Policy information including direct or agency registration, plan type (options are from basic to most sophisticated coverage)
- Hospital-related information, such as admission reasons (high level codes), length of stay and hospital status (for example previous normal/suspicious experience)
Claims experts have assessed and labelled the claims as normal or flagged the claims as possibly fraudulent. Reasons for flagged claims could be: suspicious policy profiles or malicious agencies, claims, or hospital-related fraudulent behaviour. The flagged claims are very rare in this project – 0.3% of total number of claims. This makes the model construction very challenging as the distribution of response is highly imbalanced; you could say it is like looking for a needle in a haystack.
The business goal is to detect as many of the flagged claims as possible, while not mistakenly predicting a large number of normal claims as flagged ones as this would increase investigation costs unnecessarily.
Bear in mind that in this extreme situation, any weak model would predict most of the claims as normal ones simply because they are vastly abundant, but could also easily miss most, if not all, of the flagged claims as they are so rare.
Analytics approach
We aim to develop a machine learning model – a so-called binary classifier – that can detect the two labels as correctly as possible. Since the data is already labelled, this is a supervised learning approach. Such a solution could be integrated in the business pipeline as a recommendation system, i.e., automatically and quickly processing many claims, thus acting as a machine learning-driven complementary approach to claims management.
As a reminder, the direct output of a binary classifier is a probability between 0 and 1 for each observation, each claim in this case. Depending on an assumed cut-off threshold, claims with predicted or modelled probability above (or below) that threshold would be labelled flagged (or normal). For more information about binary classification, we refer the reader to an article in Risk Insights entitled “Classification Model Performance” by Louis Rossouw.
Throughout this analysis, we assign 0 (negative) for normal claims and 1 (positive) for flagged claims. Choosing a threshold that is too high means most of the claims would be predicted as normal ones (as their predicted probability would be less than the high threshold). This would mean we lose some or most of the claims that should be flagged. At the other extreme, choosing a threshold of zero implies that most claims would be predicted to be flagged (as it is likely that most of the predicted probabilities would be larger than zero), and we know that this is not the case. Therefore, we aim at finding a “good” low threshold. We will look further into choosing an optimum threshold in the next section where we explore the economic impact of our best model.
In building machine learning models, it is common practice to choose a statistical metric or a measure with which to optimize models, but in extreme cases, as in this project, choosing metrics that will help to overcome the difficulty of identifying rare fraudulent (or “flagged”) claims is not a straightforward process. From the analytics perspective, for such highly imbalanced data, optimizing typical metrics – such as “Accuracy” (a classification metric that is the number of positive and negative correct predictions divided by all correct and false predictions) or “AUC” (another classification metric, that is the area below the ROC curve) – is not ideal for finding a good model.
This is because “Accuracy” and “AUC” are not sensitive in detecting both labels optimally at the same time. In such cases, we look for other metrics, such as the number of detected flagged claims (related to “Recall” in the technical terminology), or we monitor the behaviour of all four possible outcomes of a binary model, components of the so-called confusion matrix, that could be suitable for a specific business case. This is what we will be looking at in the current project.
Model evaluation and comparison
We applied three different algorithms: Generalized Linear Models (GLM), Gradient Boosting Machines (GBM, an ensemble of decision trees) and Neural Networks (NN, an architecture consisting of multiple layers). We compared the performance of many models within each of these algorithms to find the best model.
We constructed grids of various models using H2O, a cutting-edge machine learning platform, and used customized open-source tools. To ensure high performance of the analysis and scalability of the solution, we performed the analysis on our local supercomputer.
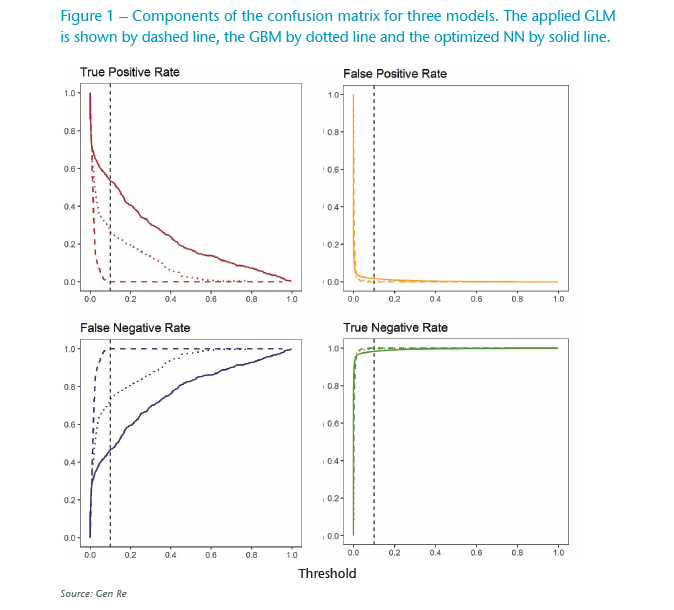
Looking at the top left panel of Figure 1, we can see that the GLM model (red dashes) could not detect any flagged claims correctly, basically zero true positive rate (TPR) across the whole range of thresholds. The blue dashes in the bottom left panel also show a very large number of false negative rate (FNR), claims wrongly detected as normal, even at very small thresholds. Thus, the GLM model is too simple for this problem, most likely with its linear and simple additive nature it could not learn the necessary patterns to correctly model this challenging imbalanced data.

Usually GBM models (ensemble of decision trees) are sophisticated enough, and by increasing their complexity (e.g. by increasing number of trees and allowing each tree to go deeper), they can perform well in learning detailed patterns. As expected, in this case, too, GBM improves the correctly detected flagged claims (true positive detection) as shown with the dotted red line in Figure 1.
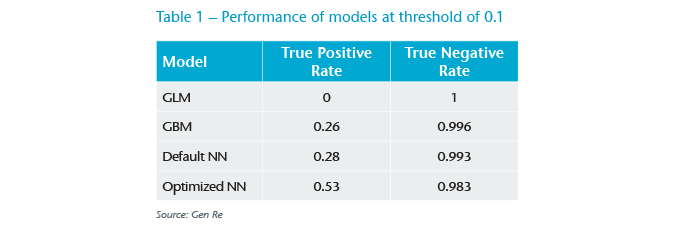
To compare the models better, we show the performance of models with a threshold of 0.1 in Table 1. We see that the GBM model still does not lead to a satisfactory performance, as it only detects about 26% of the flagged claims. This challenge seems too big even for the ensemble of decision trees.

We increased the complexity of algorithms and applied neural networks. Simply speaking, a neural network (NN) is an architecture consisting of multiple layers with many neurons on each layer that can transform their input in a non-linear way. As the information flows from the first input layer forward, errors are used to adjust weights and predictions are corrected towards the last output layer.
The strength of such an architecture is that fine patterns, including non-linear interactions between various variables, can be automatically detected without prior assumptions. As a result, NNs are superior to other algorithms in complex data applications. One key requirement of implementing NNs is having access to powerful computational hardware so that a very large amount of calculations can be performed.
We first applied a NN model with default parameters. As shown in Table 1, surprisingly we see not much improvement compared with the GBM results. In our next step, we found that with only detailed parameters tuning and applying well-known tricks in the case of imbalanced data, i.e. over-sampling the minor class in training steps, we could improve the results to achieve an acceptable level. This can be seen also in Figure 1, the solid red line in the top left panel.
It is important to have models that have a high true positive rate, and at the same time, do not have a low true negative rate (TNR). As shown in Table 1, and later in Table 2, even a slight decrease in TNR could lead to hundreds of additional false positives, which in turn would greatly increase the investigation costs.
Economic impact in model and threshold selection
So far, we have only compared the performance of these models at a subjectively assumed low threshold of 0.1. How should we pick an optimum threshold?
For this, the analytics team needs to work with business experts in order to define the satisfactory outcome. This communication led us to formulate the following economic argument: We should measure the value generated by using the machine learning model to predict flagged claims, and assume that only these claims will be investigated in more depth.
On the positive side, we have the sum of saved (not-paid) claim amounts that have been correctly detected as flagged claims (true positives). We need to subtract from this the cost of investigating wrongly detected flagged claims (false positives or FPs), which is the number of false positive claims multiplied by investigation cost. To illustrate this, in Table 2 we show each term of this argument for the optimized NN model at the threshold of 0.1, assuming 20 units for a one-hour investigation of the FPs.

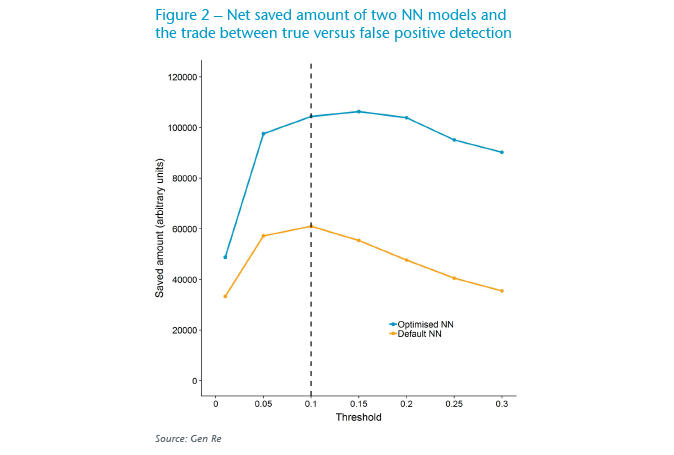
To find an optimum threshold, in Figure 2 we show this argument as a function of threshold for a small range of thresholds. Following the behaviour of the blue line, assuming 20 units for a one-hour investigation of the FPs, the saved amount maximizes around threshold values of 0.15 (both 0.1 and 0.2 are the next optimum values).

We see that the interplay of analytics versus financial demands can be practically used to constrain the threshold. For example, one can see that thresholds smaller than 0.1 are not financially ideal, as the amount saved drops (due to increase in the number of FPs, thus the increase in the second term of the above argument). On the other hand, one can argue that thresholds larger than 0.1 are not ideal analytically because the number of true positives decreases (thus some flagged claims would be missed and incorrectly paid), but this could be well-justified by business reasons if the difference leads to large enough saved amounts.
Lastly, in Figure 2 we evaluated the above economic argument for a NN with default parameters. As the orange line depicts, the saved amount is considerably lower, almost by half, in this model compared with the optimized NN model. This is consistent with the information in Table 1, where the TPR is considerably lower for the default NN model than for the optimized NN model.
This demonstrates the importance of constructing grids of models to identify stronger models as they are economically more beneficial. Integrating a better model in the pipeline improves the efficiency of business processes by more accurately classifying claims to the relevant classes.
Conclusion
In this article, we showed one example of binary classification models in claims application. This task can easily be extended to improve other parts of the insurance value chain, such as underwriting, as well as to multiple classification use-cases, e.g. by classifying underwriting decisions to standard, sub-standard and rejected outcomes, or multiple classification in customer segmentation applications where pricing or incentives should be adjusted accordingly for different groups of customers in a way that is sustainable, data-driven and non-discriminating.
In summary, we carefully evaluated top-performing models and inspected their economic impact to optimize the business-driven values. We showed that selecting an optimum threshold to classify normal and flagged claims requires communication between business and analytics teams.
To develop models that can go to production phase, constructing and evaluating many models, especially in complex models with a multitude of parameters to experiment with, is a crucial part of analytics projects.
At Gen Re, we have developed machine learning models with various interpretability methods that allow us to verify the performance of models and to better understand their outputs, as well as to optimally link the findings of analytics steps with specific business requirements.
Additionally, we have the right infrastructure both locally and in a cloud environment, that allows us to seamlessly develop grids of models, and analyse very large data projects at scale. We would be happy to engage with our clients in projects like these and tailor them to their needs.
Sources
- European Insurance and Occupational Pensions Authority (2019), Big Data Analytics in Motor and Health Insurance https://www.eiopa.europa.eu/sites/default/files/publications/eiopa_bigdataanalytics_thematicreview_april2019.pdf
- Rossouw, L. (2018), Classification Model Performance. Risk Insights Gen Re http://www.genre.com/knowledge/publications/ri18-1-en.html
- H2O.ai, an open source machine learning platform, https://www.h2o.ai/


