-
Property & Casualty
Property & Casualty Overview

Property & Casualty
We offer a full range of reinsurance products and the expertise of our talented reinsurance team.
Trending Topics
Publication
That’s a Robotaxi in Your Rear-View Mirror – What Does This Mean for Insurers?
Publication
Cat Bonds – A Threat to Traditional Reinsurance?
Publication
Decision-Making in the Age of Generative Artificial Intelligence
Publication
Buildings Made of Wood – A Challenge For Insurers?
Publication
The CrowdStrike Incident – A Wake-Up Call for Insurers?
Publication
PFAS Awareness and Concern Continues to Grow. Will the Litigation it Generates Do Likewise? -
Life & Health
Life & Health Overview

Life & Health
We offer a full range of reinsurance products and the expertise of our talented reinsurance team.
Training & Education
Publication
When Actuaries Meet Claims Managers – Data-Driven Disability Claims Review
Publication
Chronic Pain and the Role of Insurers – A Multifactorial Perspective on Causes, Therapies and Prognosis
Publication
Fasting – A Tradition Across Civilizations
Publication
Alzheimer’s Disease Overview – Detection and New Treatments
Publication
Simplicity, Interpretability, and Effective Variable Selection with LASSO Regression Moving The Dial On Mental Health
 -
Knowledge Center
Knowledge Center Overview

Knowledge Center
Our global experts share their insights on insurance industry topics.
Trending Topics -
About Us
About Us OverviewCorporate Information

Meet Gen Re
Gen Re delivers reinsurance solutions to the Life & Health and Property & Casualty insurance industries.
- Careers Careers
Individual Disability – Results of 2019 U.S. Market Survey

June 12, 2020
Lisa Bolduc
Region: North America
English
Gen Re is pleased to present the 2019 U.S. Individual Disability Market Survey results. This annual benchmarking survey covers Non-Cancelable (Non-Can), Guaranteed Renewable (GR), Buy-Sell and Guaranteed Standard Issue (GSI) product lines for 2018 and 2019. Sixteen carriers participated in the survey representing $4.9 billion of in-force premium. Of those companies, 15 reported Non-Can results, 13 GR results and seven reported on their Buy-Sell product. Eight companies reported Non-Can GSI results and four companies reported GR GSI results.
Growth calculations for 2018 to 2019 are based upon those companies providing survey data for both years and include any adjustments made to the 2018 reported data.
Download the PDF version for a list of participating companies.
Market Growth - In-force Business
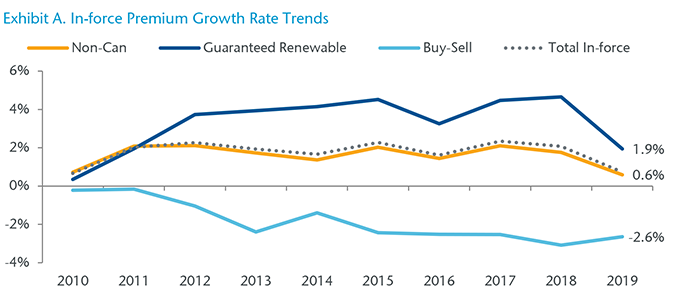
Total in-force premium (Non-Cancelable, Guaranteed Renewable and Buy-Sell combined) was flat; up less than 1% in 2019. Non-Can was level at 0.6%, GR increased 1.9%, while Buy-Sell results were negative for the 11th consecutive year at -2.6%. (Exhibit A)
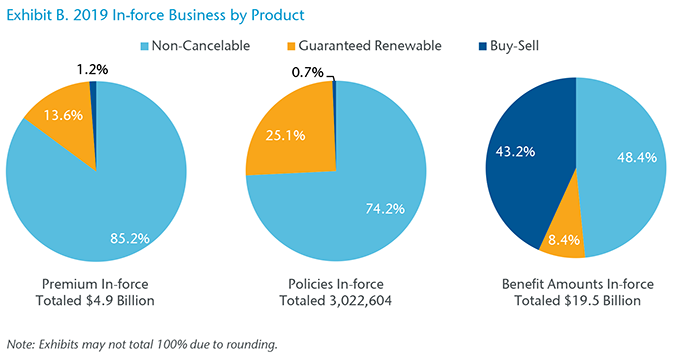
Participants reported a combined total of 3 million policies with $4.9 billion of in-force premium. Non-Can accounted for nearly $4.2 billion or 85% of total in-force business. Guaranteed Renewable accounted for $664.5 million or about 14%, and Buy-Sell accounted for the remainder. (Exhibit B)
Market Growth - New Business
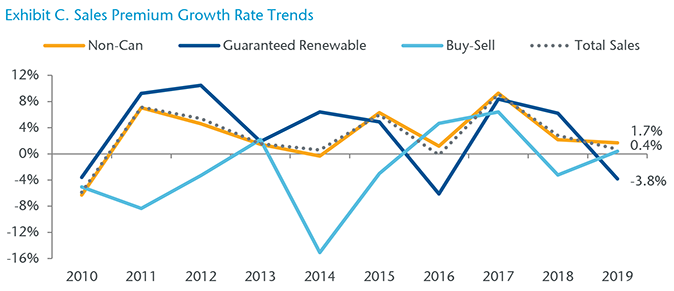
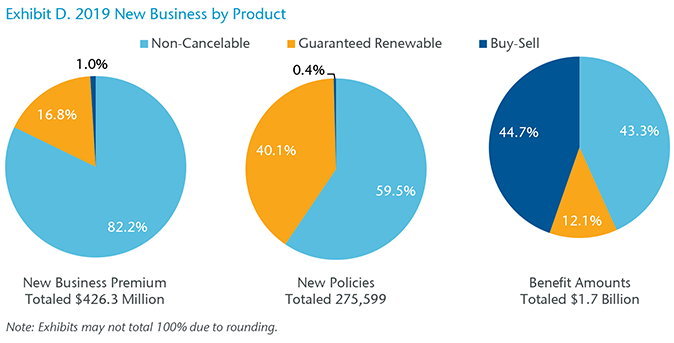
Total new sales premium growth was also flat at 0.7% to $426.3 million. Non-Can sales premium was up 1.7%, while GR sales were down, decreasing nearly 4%. Buy-Sell sales were level at 0.4%. Participants reported almost 276,000 new policies, a decline of nearly 6% from 293,000 reported for 2018. (Exhibits C, D & E)

Market Growth - Guaranteed Standard Issue Business
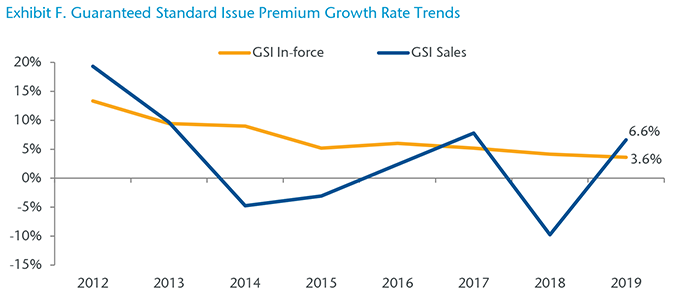
For companies that reported data for both years, total GSI in-force premium (Non-Can and GR combined) grew to nearly $390 million or 3.6% over 2018. Total new sales premium increased 6.6% to $54.4 million. (Exhibit F)
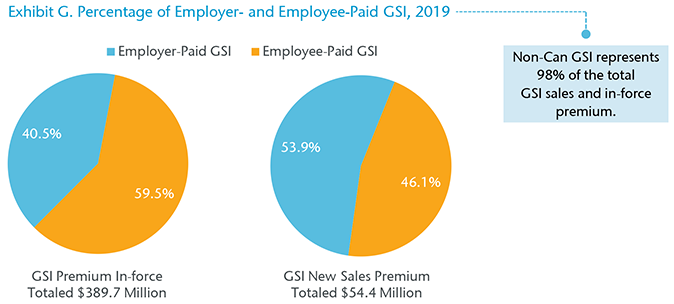
Of the total GSI premium in-force, employer-paid accounted for $158 million or 40.5% and employee-paid accounted for $231.8 million. In-force policies totaled 239,232, with employee-paid policies accounting for 146,167 or 61%. (Exhibit G)
Non-Cancelable - In-force Business
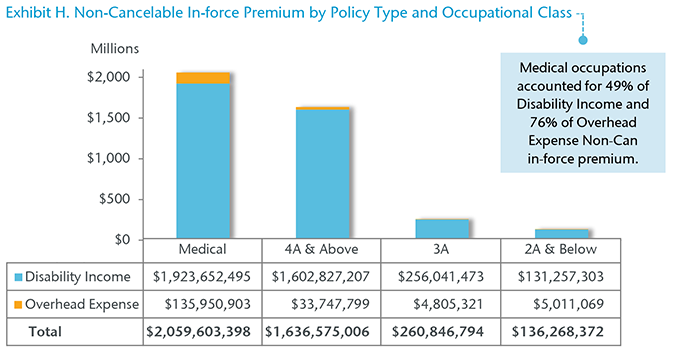
Participating companies reported $4.1 billion of Non-Cancelable in-force premium. Disability Income (DI) represented $3.9 billion or 95.6% and Overhead Expense (OE) accounted for the remainder. (Exhibit H)
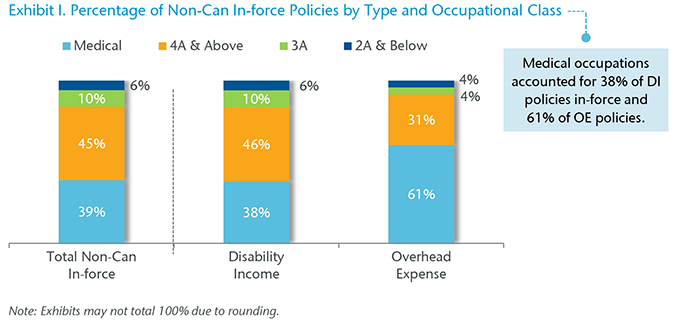
Participants reported 2.2 million Non-Can policies in-force; a decline of about 43,000 or 1.9%. DI policies accounted for 2.1 million or 96%. (Exhibit I) Although all occupational categories showed a decrease, the 3A class was hit the hardest, falling 9%.
Non-Cancelable - New Business
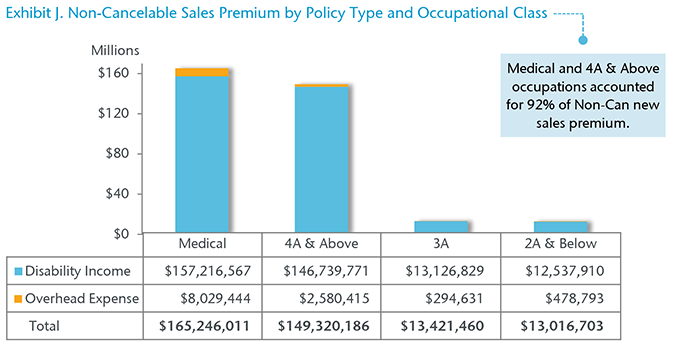
Participating companies reported $341.0 million of Non-Cancelable new sales premium. DI represented $329.6 million or 97% and OE accounted for the remainder. (Exhibit J)
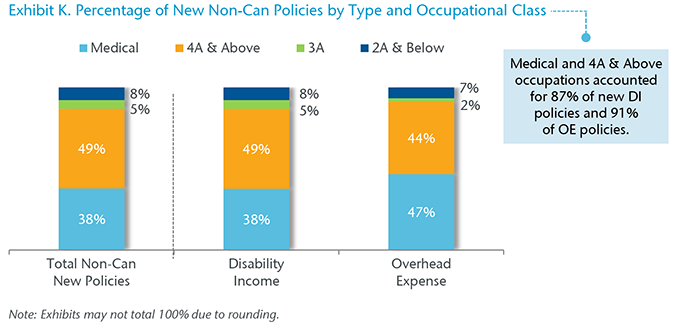
Participants issued 159,914 new Non-Can policies; a decline of 4.1% or nearly 7,000 less than for 2018. DI policies accounted for about 155,000 or 97%. Overall, the 3A and 2A & Below categories fell the sharpest at 15% and 25%, respectively. (Exhibit K)
Non-Cancelable - Guaranteed Standard Issue
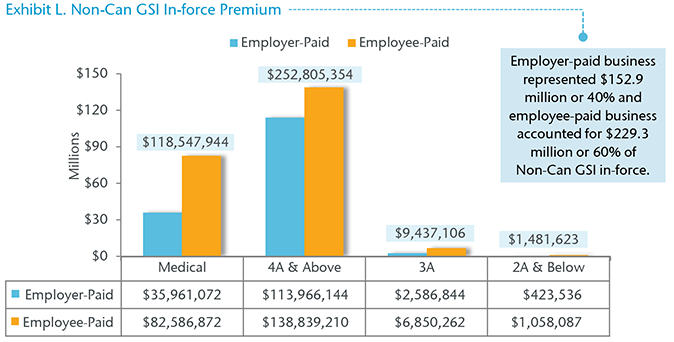
For 2019, eight companies reported $382.3 million of Non-Can GSI in-force premium; an increase of 3.7% over 2018. Premium from Medical occupations increased 10.7% to $118.5 million, while premium from the 4A & Above occupations, which accounts for 66% of the total, increased 1.2% to $252.8. (Exhibit L)
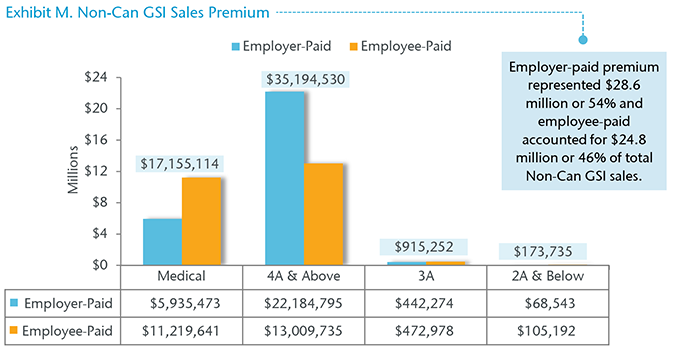
Non-Can GSI sales premium grew 7.1% to $53.4 million. Premium from employer-paid business increased nearly 25%, while employee-paid premium declined 8%. Overall, the Medical and 4A & Above occupations accounted for 98% or $52.3 million of Non-Can GSI new sales premium. Employee-paid premium represented 65.4% or $11.2 million of the total Medical sales premium. (Exhibit M)
New GSI policies increased 8.8%. Employer-paid policies grew over 30% to 15,729, while employee-paid policies fell more than 10% to 12,228.
Guaranteed Renewable – In-force Business
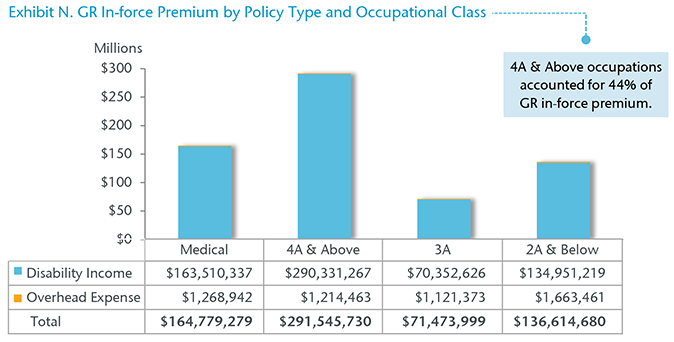
Participating companies reported $664.5 million of Guaranteed Renewable (GR) in-force premium; Disability Income accounted for $659.2 million or 99%. (Exhibit N)
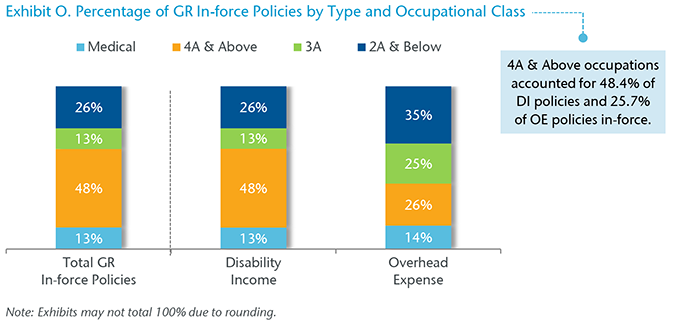
Participants reported nearly 759,000 GR policies in-force; up 1.6% over 2018. DI policies accounted for 752,000. For Overhead Expense policies, all occupational categories saw a decline ranging from 2% to 5%. (Exhibit O)
Guaranteed Renewable - New Business
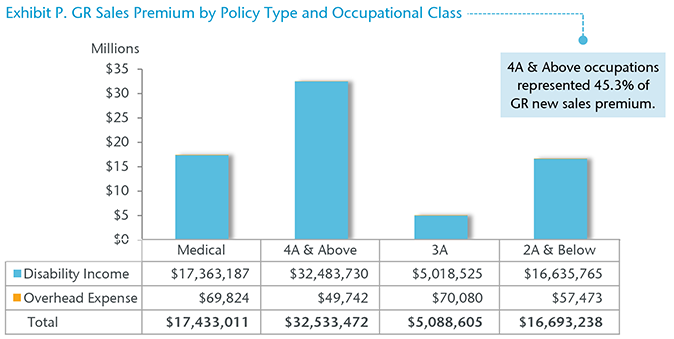
Participating companies reported $71.7 million of GR new sales premium, a decline of 3.8% over 2018. DI represented $71.5 million or 99.7%. (Exhibit P) Overhead Expense premium fell 22.8% to $247,121.
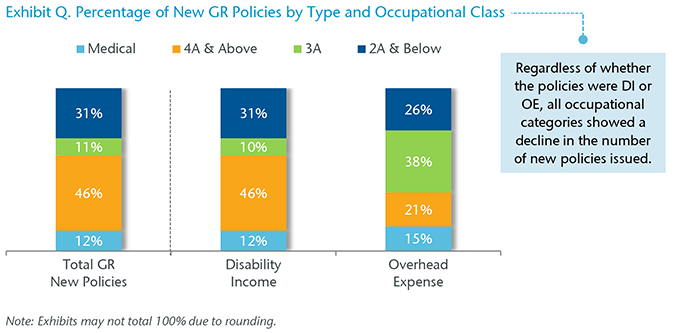
Participants issued 110,534 new GR policies in 2019; a decline of nearly 9% over 2018. DI policies accounted for nearly all at 110,295. 4A & Above policies accounted for 51,187 or 46.3% of the total. (Exhibit Q)
Guaranteed Renewable - Guaranteed Standard Issue
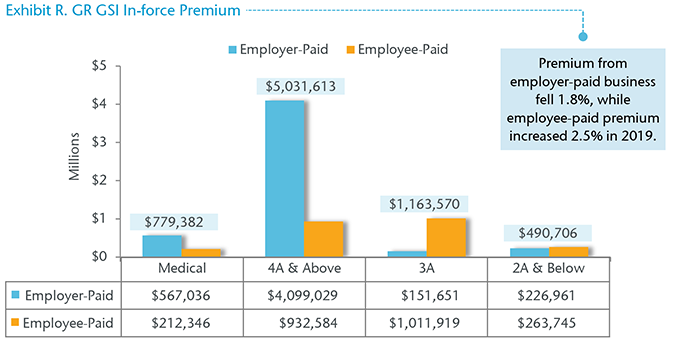
Four companies reported almost $7.5 million of Guaranteed Renewable GSI in-force premium for 2019; slightly less (-0.4%) than 2018 results. Employer-paid premium represented 67.6% or $5.0 million and employee-paid accounted for 32.4% or $2.4 million. (Exhibit R)
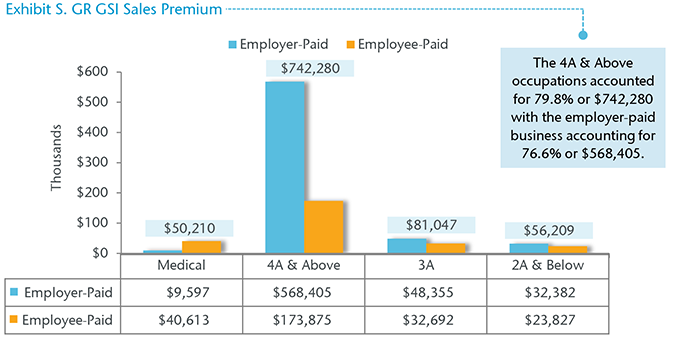
After a decline of 23% in 2018, GR GSI sales premium fell 14% to under $1 million in 2019. Employer-paid business accounted for 70.9% or $658,739 and employee-paid represented 29.1% or $271,007. (Exhibit S)
The number of new GSI policies issued fell nearly 16%; from 1,231 in 2018 to 1,037 in 2019. Employer-and employee-paid policies declined 5.7% and 27.2%, respectively.
Buy-Sell - New and In-force Business
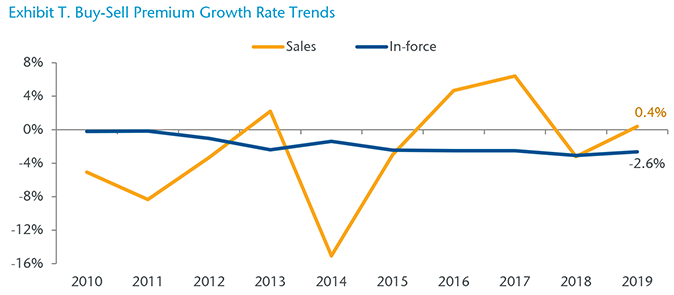
Buy-Sell in-force premium has been trending downward for more than a decade, and in 2019 premium declined 2.6% to $56.5 million. After falling 3.1% in 2018, participating companies reported a slight uptick (0.4%) in new sales premium to more than $4.1 million. (Exhibit T)
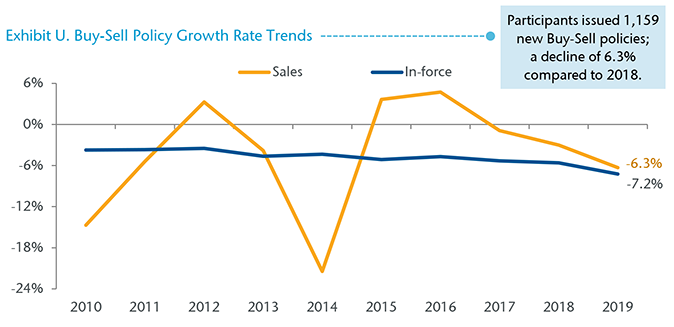
The number of Buy-Sell policies in-force fell to 20,004; a decline of 7.2 % compared to 2018. In-force policies have also been on the decline since 2005, when we reported a high of nearly 40,000 Buy-Sell policies in-force. (Exhibit U)
In Our View
The slowdown of the Individual Disability market continued in 2019. Overall, new sales business and total in-force business was flat across the industry at $426 million and $4.9 billion, respectively. There was marginal growth with new Non-Can sales up 1.9%; however, this was offset by a drop in new GR sales of 3.8%.
Although the industry was flat overall, 50% of responding companies (8) reported their 2019 sales goals exceeded their stated 2019 goal. Of the remaining eight companies, three reported meeting their goals. Many companies that reported exceeding their sales goals stated strong GSI results was the driving factor. Even with a flat market, most companies continue to experience positive results. Almost 90% of the companies responding to our survey stated their 2019 claims experience either met or exceeded their plan.
As mentioned above, the GSI market did experience healthy growth in 2019 after declining nearly 10% in 2018. Overall GSI sales were up 6.6% with new premium of $54.4 million. Employer-paid business accounted for 54% of this new premium which is a slight change over the past few years when employee-paid made up more than 50% of the new business sold.
In addition to the numbers, we continue to ask participants their thoughts on the industry and what some of the opportunities and challenges may be in the future. Distribution is a topic that continues to be at the top of the list for most companies and this year we heard both pros and cons. Several carriers that exceeded their 2019 sales plans listed strong and new distribution as a contributing factor. On the other hand, a few carriers that met or did not meet their 2019 expectations listed not having enough qualified distribution to sell their product. This is certainly a recurring theme that continues to be top of mind for all carriers when asked about their concerns for the industry. We also heard from carriers and their concerns about lack of market diversity and the aggressive underwriting guidelines that carriers continue to push. These are certainly all topics that Gen Re will continue to follow within the industry.
As of the publication of this report, we are in the midst of the COVID-19 crisis, so it is difficult to tell what impact this will have on the Individual Disability market in 2020 and beyond. The 2019 results do show that the business continues to provide positive results for most carriers. However, these positive results come with some areas of concern. This is going to be an interesting year for all insurance carriers, regardless of product. Gen Re will be here to help support the industry however we can.


