-
Property & Casualty
Property & Casualty Overview
Property & Casualty
We offer a full range of reinsurance products and the expertise of our talented reinsurance team.
Trending Topics
Publication
That’s a Robotaxi in Your Rear-View Mirror – What Does This Mean for Insurers?
Publication
Cat Bonds – A Threat to Traditional Reinsurance?
Publication
Decision-Making in the Age of Generative Artificial Intelligence
Publication
Buildings Made of Wood – A Challenge For Insurers?
Publication
The CrowdStrike Incident – A Wake-Up Call for Insurers?
Publication
PFAS Awareness and Concern Continues to Grow. Will the Litigation it Generates Do Likewise? -
Life & Health
Life & Health Overview

Life & Health
We offer a full range of reinsurance products and the expertise of our talented reinsurance team.
Training & Education
Publication
When Actuaries Meet Claims Managers – Data-Driven Disability Claims Review
Publication
Chronic Pain and the Role of Insurers – A Multifactorial Perspective on Causes, Therapies and Prognosis
Publication
Fasting – A Tradition Across Civilizations
Publication
Alzheimer’s Disease Overview – Detection and New Treatments
Publication
Simplicity, Interpretability, and Effective Variable Selection with LASSO Regression Moving The Dial On Mental Health
 -
Knowledge Center
Knowledge Center Overview

Knowledge Center
Our global experts share their insights on insurance industry topics.
Trending Topics -
About Us
About Us OverviewCorporate Information

Meet Gen Re
Gen Re delivers reinsurance solutions to the Life & Health and Property & Casualty insurance industries.
- Careers Careers
Wildfire Season Is Here - Underwriting Factors and Tools for the Wildfire Peril [Part 1 of series]

August 10, 2020
Marc Dahling,
Chris White, Chief Operating Officer of the Anchor Point Group LLC (guest contributor)
Region: North America
English
Wildfire in the U.S. has recently evolved from a secondary afterthought to more of a primary peril. We have seen the insurance industry scrambling to find information, resources and tools to help deal with this highly destructive peril that is more prevalent than commonly perceived. Last year Gen Re published an article that explored many of the potential contributing factors and limitations with the existing tools to properly evaluate this catastrophic peril.
As a follow-up, this year we have reached out to Chris White, a well-known expert in the field of wildfire risk and mitigation. Chris is a principal of Anchor Point, a wildland fire solutions company based in Boulder, Colorado, that has developed a national wildland fire hazard and risk model as an underwriting tool (“No-HARM”) for the insurance industry.1
Our conversations with Chris always bring forward some interesting and informative insights on wildfire from a national and local perspective, so we wanted to share some of our learnings in this Q&A with him.
Q. We are already into the U.S. fire season in Colorado, California, and the rest of the Southwest - as an expert in the field of Wildfire what are your predictions for the rest of 2020 and early 2021 wildfire season?
I learned many years ago to offer my insights at the end of wildfire season! Wildfire seasonal prediction is as much an art as a science, just as long-term weather or drought prediction is. The best and most accurate short- and mid-term predictions come from the National Interagency Fire Center at NIFC Predictive Services. Here is a link to the August 1, 2020 National Significant Wildland Fire Potential Outlook. Predictive Services are also available at a regional level.
Q. Understandably, a lot of models focus on the Western 13 states, but Anchor Point is providing nationwide analysis. Outside of the Western 13 states, which states or areas do you think warrant a closer wildfire evaluation and why?
Fires, including significant fires, occur throughout the U.S. The image below shows fires of over 100 acres that have occurred nationally since the early 1990s through 2015.
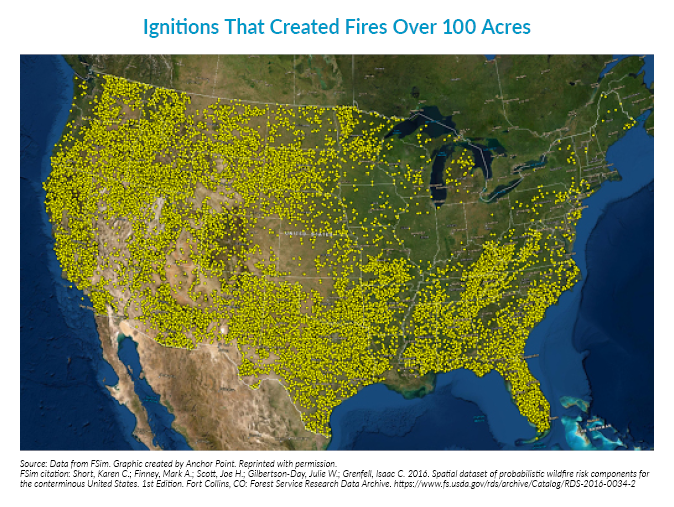
In 1998 Florida experienced over 2,200 fires that destroyed 337 homes, 33 businesses and forced the evacuation of thousands. In 2016, on behalf of FEMA, we investigated the Chimney Tops 2 Fire in Sevier County/Gatlinburg Tennessee. Over 2,000 buildings, many commercial, were damaged or destroyed and 14,000 were evacuated. In 1999 over a million trees were blown down due to 80-100 MPH winds in Northeastern Minnesota. This was the fuel for the 76,000-acre Ham Lake fire in 2007 and part of the 93,000-acre Pagami Creek fire in 2011.
In 1995 a fire broke out near Southampton on Long Island, New York (yes, Long Island!). Fire Resources from the area, including FDNY responded. The fire ran approximately 7,000 acres and burned numerous homes and small businesses. Again on Long Island in 2012, the Brookhaven Blaze burned 2,000 acres.
Just south in New Jersey, the Pine Barrens area has a significant fire history. In 1963 fires burned more than 183,000 acres in an event nicknamed Black Saturday. In 2016 Rolling Stone magazine wrote an interesting article entitled, “Will America’s worst wildfire disaster happen in New Jersey?”. The combination of volatile vegetation, in the Pine Barrens region, and extensive development in that area, does set the stage for a catastrophic event that may also endanger many lives.
Eastern states have a lower probability of experiencing a catastrophic event but the vegetation in many areas can exhibit extreme fire behavior under the right conditions. This, in combination with a much denser development pattern than in the West, gives us concern in some areas. The list of fires east of the western 13 states goes on and on. Outside of the Chimney Tops 2 Fire, the magnitude of loss doesn’t compare with the West but what we saw in Eastern Tennessee was scary and we hope it doesn’t represent the new normal.
Q. All models are only as good as the underlying data used to construct them. For the peril of Wildfire, a lot of models utilize publicly available data produced by LANDFIRE - a shared program between the wildland fire management programs of the U.S. Forest Service and the U.S. Department of the Interior. How appropriate is the LANDFIRE data for (re)insurers looking to evaluate wildfire exposure? What limitations or considerations need to be factored in when repurposing for this use?
The work and products that come out of LANDFIRE are an essential element in national wildfire operations and planning and are used by fire professionals daily. The LANDFIRE website states: “LANDFIRE products were designed to support Landscape‐scale analysis - national and regional strategic planning, strategic/tactical planning for large sub‐regional landscapes, and Fire Management Units (FMUs) such as significant portions of states or multiple federal administrative entities.”
LANDFIRE supports this mission well. As described, it is not a program designed to support the scale and local accuracy necessary for an insurance underwriting product such as our National Hazard and Risk Model (No-HARM) without significant interpretation. No-HARM utilizes some of the data that comes out of LANDFIRE, particularly the LANDFIRE Fuel Products, as input variables to fire behavior modeling. This is the only national "satellite collect" of vegetation that is converted to fuel models.
Having worked with LANDFIRE fuels for many years we have come to understand the strengths and weaknesses of the data when utilized for high detailed risk analysis, particularly in communities with complicated vegetation patterns. What is essential is that this data, like any other, is properly interpreted and used. This can only be accomplished by Fire Behavior Analysts (FBAN), Long Term Analysts (LTAN) and other fire scientists. The value in utilizing an FBAN is that they are both certified fire behavior scientists and have extensive field experience working on actual fires. This combination is essential to interpret how the LANDFIRE fuels, and other data, can and should be used when targeting fire effects to buildings.
A good example is that LANDFIRE accurately identifies tall grasses as a very significant fuel model, one that exhibits long flame lengths. This is true but within the context of an underwriting tool, grasses may not have the resonance time to significantly damage homes. This is to say that a less intense fuel model, that burns longer, may impact a home more significantly than a fuel that burns intensely but for a very short duration.
This understanding of multiple variables and how they affect structure damage is at the core of prediction loss in the wildland urban interface.
GEN RE PERSPECTIVE
In 2019 Gen Re published an article entitled “Underwriting Wildfire - Creating Your Hazard Map” that raised many issues and factors to consider when evaluating the peril of Wildfire. The main focus was to encourage insurers to creatively explore and better understand data, facts and elements that may be beyond current analytical capabilities of the tools and models available to insurers.
While California and other western states grab the vast majority of attention from coverage of wildfires, the Tennessee fire was a painful reminder of the elevated insurance tail exposure of this peril in highly concentrated areas outside the western states. The potential for a tail event exists in every state in the country, so we encourage folks to not confine their underwriting and accumulation attention to only known hotspots.
In our collaboration with Anchor Point for this publication, we discussed data constraints at length. We believe the examples of the LANDFIRE Data’s potential limitations for insurance applications - and the need for accurate interpretation - are critical to appreciate, and this could be true for other non-insurance data sources as well.
We hope you found this Q&A exchange informative, and we encourage you to reach out to Chris at Anchor Point if you have another question for him – and also to your Gen Re representative to discuss how we can help you with this topic.
Keep an eye open for the next part of our conversation with Chris, about the specific conditions and factors that can significantly impact vulnerability to wildfire danger and damage.
Endnote
- Gen Re does not have any business relationships with Anchor Point and makes no recommendations regarding their use. The views expressed in the Anchor Point answers are those of Anchor Point.
 Chris White is the COO of the Anchor Point Group LLC. He has specialized in Wildland-Urban Interface Fire Management for over 30 years. He started his fire career in 1987 working with both the U.S. and Colorado State Forest Service. Chris then became Colorado’s first county-level Wildland Fire Coordinator in Summit County.
Chris and his Anchor Point team consult with FEMA, providing fire investigation and policy direction. He has worked with the Western Governors Association Federal Fire Policy Review Committee, The National Wildfire Coordinating Group Hazard and Risk Assessment Methodology Committee, National Fire Protection Association Wildland Fire Committee, as well as collaboration with the International Association of Fire Chiefs on international initiatives.
Chris is a NWCG certified Structure Protection Specialist and has worked with Type 1 and 2 Incident Management Teams throughout the U.S. on major wildfires.


