-
Property & Casualty
Property & Casualty Overview

Property & Casualty
We offer a full range of reinsurance products and the expertise of our talented reinsurance team.
Expertise
Publication
Production of Lithium-Ion Batteries
Publication
Time to Limit the Risk of Cyber War in Property (Re)insurance
Publication
Generative Artificial Intelligence in Insurance – Three Lessons for Transformation from Past Arrivals of General-Purpose Technologies
Publication
Human Activity Generates Carbon and Warms the Atmosphere. Is Human Ingenuity Part of the Solution?
Publication
Inflation – What’s Next for the Insurance Industry and the Policyholders it Serves? -
Life & Health
Life & Health Overview

Life & Health
Gen Re’s valuable insights and risk transfer solutions help clients improve their business results. With tailor-made reinsurance programs, clients can achieve their life & health risk management objectives.
UnderwritingTraining & Education
Publication
The Key Elements of Critical Illness Definitions for Mental Health Disorders
Publication
What Are We to Make of Cannabis Use in The Insured Population? Business School
Publication
Knife or Needle: Will the New Weight Loss Medication Replace Bariatric Surgery?
Publication
Weight Loss Medication of the Future – Will We Soon Live in a Society Without Obesity? Moving The Dial On Mental Health
 -
Knowledge Center
Knowledge Center Overview

Knowledge Center
Our global experts share their insights on insurance industry topics.
Trending Topics -
About Us
About Us OverviewCorporate Information

Meet Gen Re
Gen Re delivers reinsurance solutions to the Life & Health and Property & Casualty insurance industries.
- Careers Careers
Gen Re’s Dread Disease Survey and Insights From a Regional Analysis for China

September 03, 2019
Tuan Miang Chua
Region: Asia
English
Gen Re has been conducting product and claim experience surveys of Dread Disease products in Asia since the mid-1990s. From 2005, we started to include information and data from Mainland China. In the latest survey covering the period from 2012 to 2015, which included 110 million in-force policies and 1.3 million claims, about 90% of the data originated from the 14 participating companies in Mainland China. In this second part of the insights from Gen Re’s Dread Disease Survey 2012–2015, we will delve into the regional analysis for China.
China is a diversified market in terms of biometric risk, driven by the varied lifestyles and living environments in its different regions. An in-depth discussion on this may help the industry and the public better understand the following areas:
- The market of China consists of different types of insurance companies: state-owned, Chinese private capital, joint ventures and foreign companies. Usually, joint ventures and foreign companies have more exposure in the largest, or what local media call “first-tier” and “second-tier”, cities of East, South and North China.1 In contrast, state-owned companies tend to operate nationwide. Therefore, when we look at the difference in the overall experience by company, we should consider the impact of the geographic origin of their business rather than simply blaming it on the quality of their operation.
- Just like age, gender and smoking status, geographic factors are also an important factor affecting the biometric risk of the insured. However, all insurance companies in China use uniform rates for the whole country and consequently policyholders in areas with low biometric risk cross-subsidise those in areas with higher risk. Our analysis provides a reference for regional pricing that might emerge in the future.
- Since the early 2010s, Hong Kong has received more cross-border business from Mainland China. For this business, most Hong Kong companies charge a unified loading (or waive the loading) regardless of where in China the business originates. Our analysis helps Hong Kong companies review the rationality of this approach and understand the risk characteristics of customers in different regions of Mainland China.
- China still lacks epidemiological analysis targeting regional variances. Insurance data provides relatively accurate exposure and incidence data and, very importantly, a huge sample size. This is a good reference for the academic community to evaluate the disease burden of the country by geographies. Of course, we should bear in mind that the socioeconomic status of insurance customers differs from the general population, and the incidence is affected by the balance between underwriting effects and anti-selection effects.
Our survey collected data at prefecture level, but due to space constraints we will show results mainly at provincial level.
Business Origin
We divided the in-force policies at the end of 2015 by region; we found that 27.3% of policies are from the top three provinces, Shandong, Guangdong and Henan, which are also the three most populous provinces in China. The bottom three are Hainan, Qinghai and Tibet with a total contribution of 0.7%. At city level, apart from the four municipalities (Beijing, Chongqing, Shanghai and Tianjin), Guangzhou, Chengdu (capital city of Sichuan province), Shenzhen, Zhengzhou (capital city of Henan province), Qingdao and Dalian are also amongst the top 10 cities.
We also calculated the penetration of Dread Disease insurance by simply dividing the policy count by the corresponding population size. Beijing has the highest coverage of 16.7%, followed by the 12.0% in Ningxia and 10.8% in Heilongjiang. The figures in Ningxia and Heilongjiang are somewhat surprising as neither of them is amongst the most developed provinces in China. Shanghai’s coverage is barely 7.3%, which is not commensurate with its status as the economic centre of China. The bottom three in terms of penetration are Yunnan, Guizhou and Tibet. These three are also the least developed provinces in the country.
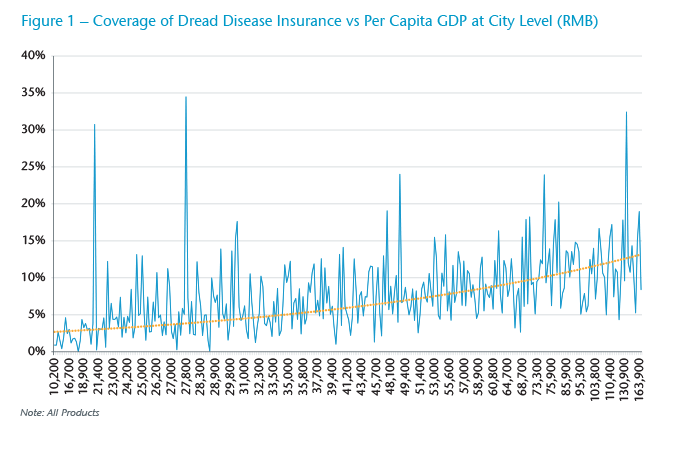
We draw a curve for the relationship between the coverage of Dread Disease insurance and the per capita GDP in each prefecture (Figure 1). There is clear positive correlation though fluctuations do exist.
All Claim Causes
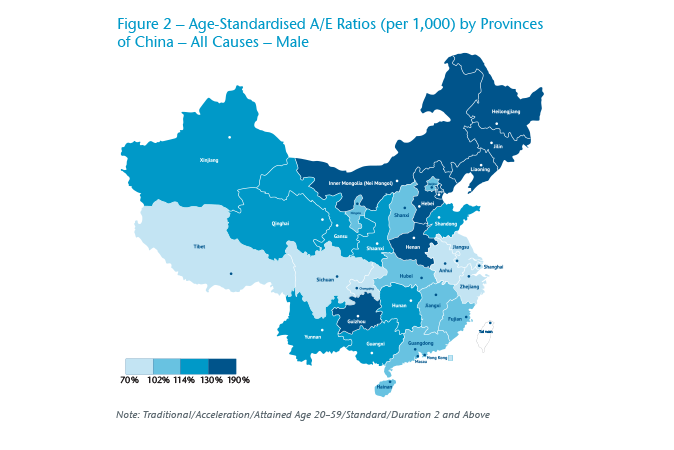
We observed significant regional differences in claim experience in China. For men, the worst experience comes from the three northeastern provinces (A/E: Heilongjiang 183%, Jilin 174%, Liaoning 143%), Inner Mongolia (168%) and Henan (158%), which is 20%–50% higher than the market average of 122% (Figure 2).2 At prefecture level, the highest A/E is from Hinggan in Inner Mongolia (234%), followed by Baicheng (215%), Heihe (213%), Daxinganling (207%) and Qitaihe (205%). The 20 cities with the highest loss ratios are from the top five provinces.
For women, the worst five provinces are similar to those for males, except that Jilin is replaced by Shanghai (Figure 3). The A/E of the worst five provinces is 15%–40% higher than the market average of 115%. Again, with the exception of Wenzhou, a city in Zhejiang province, the other 19 cities with the worst A/E are from the worst five provinces.
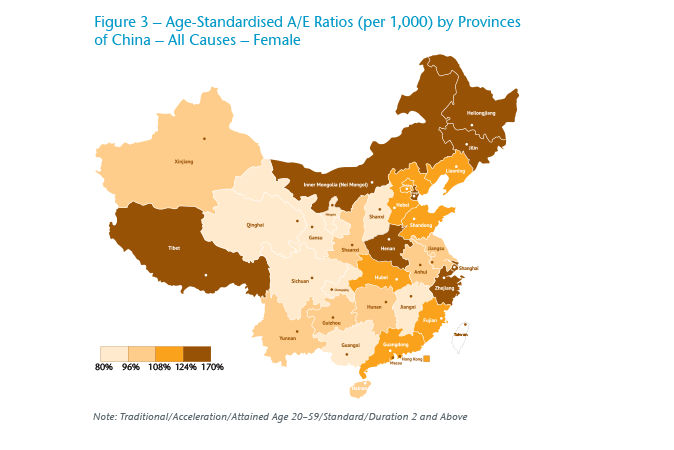
It is worth noting that Shanghai has the fourth worst experience for females, but at the same time its male experience is the best of the whole market. As Shanghai is considered the most economically developed city in China, this suggests that economic growth has a totally different impact on the two genders. Hong Kong’s experience also supports this. Hong Kong’s A/E ratio is only 76% for males, in comparison with Shanghai’s 94% and the average of 122% in China. However, Hong Kong’s A/E ratio for females is 114%, which is around the average of China and not at all low. We will discuss this in more detail in later sections.
Another interesting finding is that Sichuan province and Chongqing municipality, both located in Southwest China, present very good experience regardless of gender. Sichuan’s experience ranks second best for both genders. Chongqing ranks fifth best for men and third best for women.
In summary, claims experience of the same region could be bad for both genders (the three northeastern provinces and Inner Mongolia), or be good for both genders (Sichuan and Chongqing), or be bad for one gender and good for the other (Shanghai and Hong Kong). There must be some complicated mechanisms under the three distinct scenarios requiring further investigation.
Disease-Specific Analysis
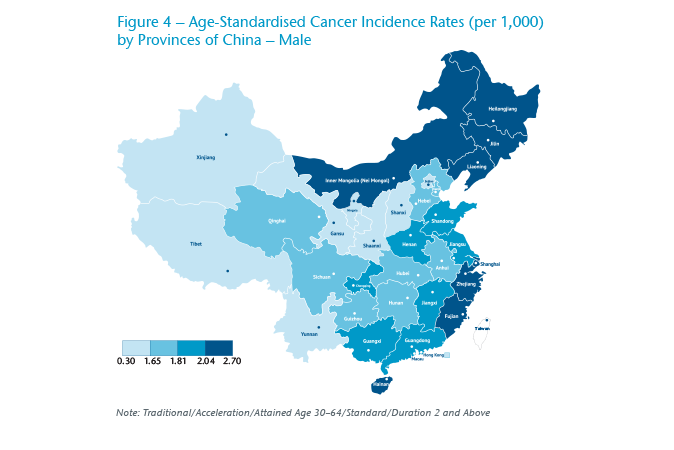
For both genders, people living in Northeast China, Inner Mongolia and coastal provinces are at higher risk of cancer (Figure 4 and Figure 5). Male insured lives in Heilongjiang and Jilin province have a higher risk of colorectal, liver, lung and thyroid cancer; male insured lives in Fujian province are vulnerable to nasopharyngeal, gastro-oesophageal, colorectal and liver cancer. Compared with mainlanders, Hong Kong males have a fairly low risk of cancer, which is largely attributable to the efforts of government and private organisations during the past decades to combat major cancers.3 During the period, the incidence rate of lung, stomach and liver cancer has decreased by more than half.
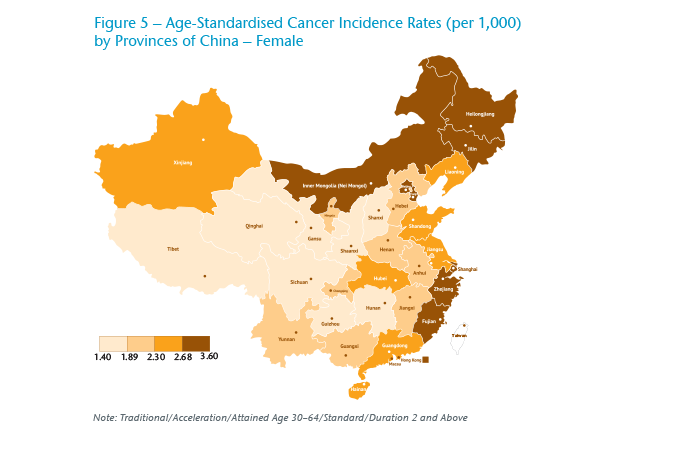
For females, Shanghai has the highest overall cancer risk in China and has the highest risk for breast cancer, colorectal cancer and lung cancer. Interestingly, the top seven provinces for total cancer incidence are also the top seven for thyroid cancer alone.
Nasopharyngeal cancer (NPC) is well known for being endemic in Southern China and Southeast Asia. In China, Guangdong, Guangxi and Hainan province have the highest risk. As latitude increases, the risk of nasopharyngeal cancer decreases rapidly. The difference between Southern China and Northern China is more than ten times.
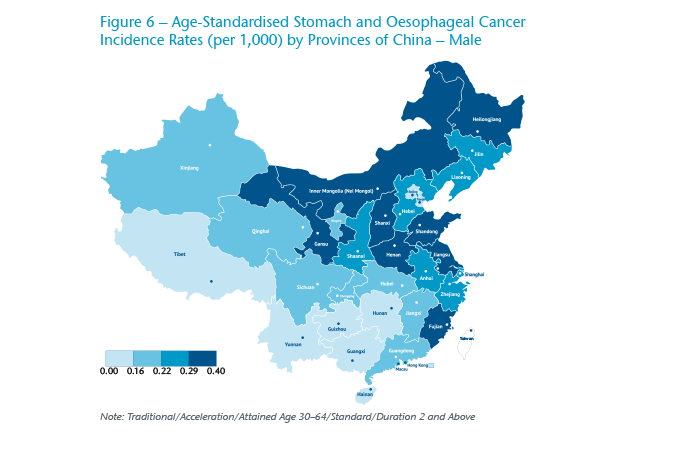
The distribution of gastro-oesophageal cancer incidence generally shows a downward trend from the northeast to the southwest (Figure 6). The distribution of liver cancer incidence is consistent with the hepatitis B virus (HBV) infection rate in the population data. This is reasonable considering that HBV is the leading cause of liver cancer in China.
In economically more developed regions, the fertility rates are usually lower and people have easier access to mammography screening, which may lead to a higher incidence of breast cancer. The breast cancer incidence shows a very obvious decreasing trend from east to west. Shanghai, the most developed city in China, has the highest breast cancer incidence rate, followed by Beijing, Northeast China and Guangdong province. Hong Kong’s breast cancer risk is yet another 57% higher than Shanghai’s. This suggests that economic development may lead to a higher incidence of breast cancer. However, there is evidence in the United States that much screening in women under the age of 50 is actually unnecessary.4
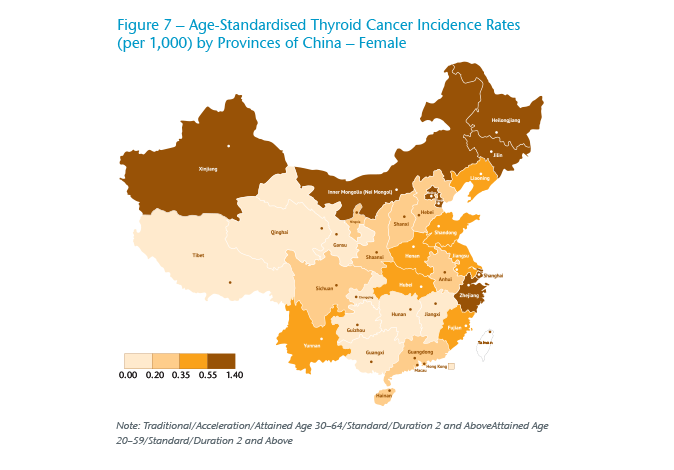
Thyroid cancer is no doubt the cancer that has attracted most attention in the industry during the past 10 years due to the surging incidence in China. The geographical distribution of thyroid cancer is uneven (Figure 7). Jilin province, Zhejiang province and Shanghai are ranked the top three, and their incidence rate is 10 times higher than that of the bottom three provinces. Thyroid cancer incidence is heavily correlated with per capita GDP or disposable income at city level. This makes sense because the surge of thyroid cancer incidence is mainly driven by ultrasound-based screening and people living in wealthy areas being more likely to undergo screening.
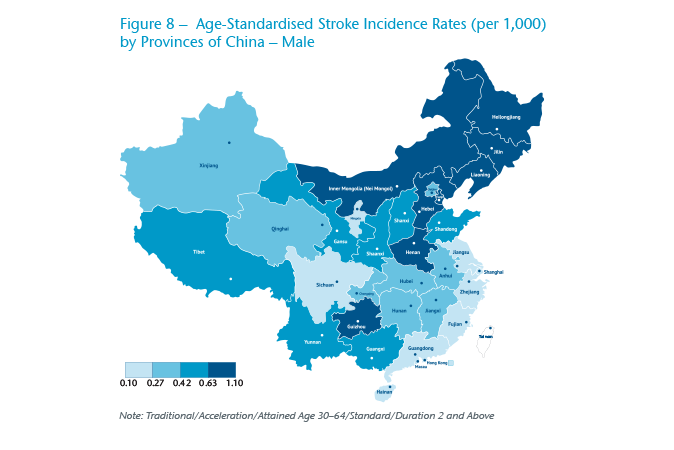
As discussed earlier, stroke and heart attack are both severe disorders of the vascular system and they have common risk factors. So it is not surprising that they also show a similar geographic distribution (Figure 8). Overall, people living in Northern China have a much higher risk than people living in Southern China. This is consistent with the distribution of risk factors, such as hypertension, diabetes and obesity observed in population data. The cold weather in Northern China is possibly playing some role here. In cold weather, blood vessels are more likely to contract, raising the risk of ischaemia. At the same time, cold weather also limits people’s outdoor exercise, which in turn increases the risk of cardiovascular disease. In further analysis, we notice that the incidence of heart attack and stroke peaks in January.
City Tiers
China is a country with uneven economic development. Economic factors may affect people’s living environment, lifestyle and affordability of disease prevention and control by local government, which in turn affects the incidence of major diseases.
Cancer risk does not vary much by city tier for males, but for females it obviously decreases from major cities to less developed cities. Gastro-oesophageal cancer risk for males and liver cancer risk for both genders increases in less developed cities. Such cancers are called “cancers of the poor” because they are mainly caused by infection factors and people living in wealthy areas have better awareness and financial capacity to control them.
By contrast, female breast cancer, thyroid cancer and colorectal cancer show an inverse relation with city tier, with the highest incidence rate observed in major cities. These cancers are called “cancers of the rich” because they are mainly driven by screening and affluent lifestyle.
The difference in cancer rates by city tier is not significant for males, probably because of the uniformly high smoking rate across the country. Women living in less developed cities usually have a more conservative lifestyle and lower smoking rate and thus lower lung cancer incidence.
Stroke incidence is much higher in lower tier cities compared with first-tier. This suggests that major cities in China have crossed the peak of the bell-shape curve (between stroke risk and economic status) and is consistent with the downward trend of stroke observed since 2011 in our survey series.
Heart attack incidence rates show a concave shape, with the lowest incidence rate observed in major cities. The high incidence in less developed cities could be explained in the same way as for stroke. The high incidence in major cities could be explained by the common usage of troponin, a sensitive biomarker for myocardial necrosis that can increase detection of heart attacks by more than 30%.5
Conclusion
The Dread Disease market in China is evolving very quickly. While the product is currently distributed mainly through agency force, we are seeing that other distribution channels, especially online, are making inroads into the market. Consumer awareness of the product is increasing, and more and more consumers are looking at purchasing products that are designed for and catered to their specific needs, rather than a one-product-fit-all concept. It is important that insurance companies are well aware of the risks presented by the different group of customers, including customers from different regions. We plan to continue conducing such China regional analysis and provide the market with further updates in the future.
Endnotes
- https://en.wikipedia.org/wiki/Chinese_city_tier_system.
- For an “Actual-to-Expected (A/E) ratio”, “actual” refers to the number of actual claims. The expected (E) number of claims are calculated using the graduated rates (ix+qx-kxqx) we derived from our survey 2000-2004. It is based on the combined results of the Hong Kong, Singapore and Malaysia markets.
- https://www.hkacs.org.hk/en/medicalnews.php?id=16, https://en.wikipedia.org/wiki/Smoking_in_Hong_Kong.
- https://www.washingtonpost.com/posteverything/wp/2015/05/05/stop-routine-screening-for-breast-cancer-for-women-under-50-science-has-shown-it-doesnt-save-lives/?utm_term=.bb4023c68936.
- Trevelyan, J. et al., Sources of diagnostic inaccuracy of conventional versus new diagnostic criteria for MI Heart 2003; 89:1406–1410; https://www.ncbi.nlm.nih.gov/pmc/articles/PMC1767993/.

Chief Executive, Asia Life/Health & General Manager, Shanghai Branch
See All Articles


